

Welcome to another edition of Earth Observation Essentials, the free biweekly newsletter from TerraWatch covering key highlights from the EO market along with exclusive insights and analysis.
If you would like a more detailed, comprehensive market briefing with exclusive analysis, delivered every week, become a Pro subscriber, or a Premium subscriber, for more deep dives on EO markets, technologies and applications.
📈 EO Market Highlights
Major developments in EO
💰 Spanish EO startup Xoople raised $130M in Series B funding to map the Earth for AI, and also announced a contract US-based L3Harris Technologies to begin building sensors for Xoople’s satellite constellation.
💰 Starcloud raised $170M in Series A funding to build data centers in space, with a valuation at $1.1B - the company also mentioned that the business model in the short-term will be selling processing power to other spacecraft on orbit, or, in other words, enabling edge computing for EO satellites (more below).
🛰️ Vantor announced plans to launch two new EO constellations: one with 20 cm imagery and the other with 40 cm capable of rapid revisit through small sats – signalling that even the industry's leader in resolution now accepts the market demands both high fidelity and high frequency.
🇺🇸 The US administration proposed an $18.8B fiscal 2027 budget for NASA, a 23% decrease from FY2026, which warrants a 52% cut to Earth science – from $2.15B enacted in FY2026 to $1.02B requested for FY2027.
In addition to cancellation of several Earth science missions (see my LinkedIn post for more), the budget proposal also calls for "one final Landsat satellite", providing $109M to support the transition of Landsat to a commercial solution.
💡 Insight Bytes
A quick dose of analysis from TerraWatch
The 2026 Earth Observation Adoption Hype Cycle – And Why It is Not Very Useful
Below is the 2026 edition of my EO Adoption Hype Cycle. Twenty use cases, positioned based on three criteria: willingness to pay for commercial satellite data, the real state of recurring revenue and company growth behind each use case. I am not going to claim this is a scientifically robust methodology as there is a level of approximation involved (due to lack of information) and of course, my own bias.
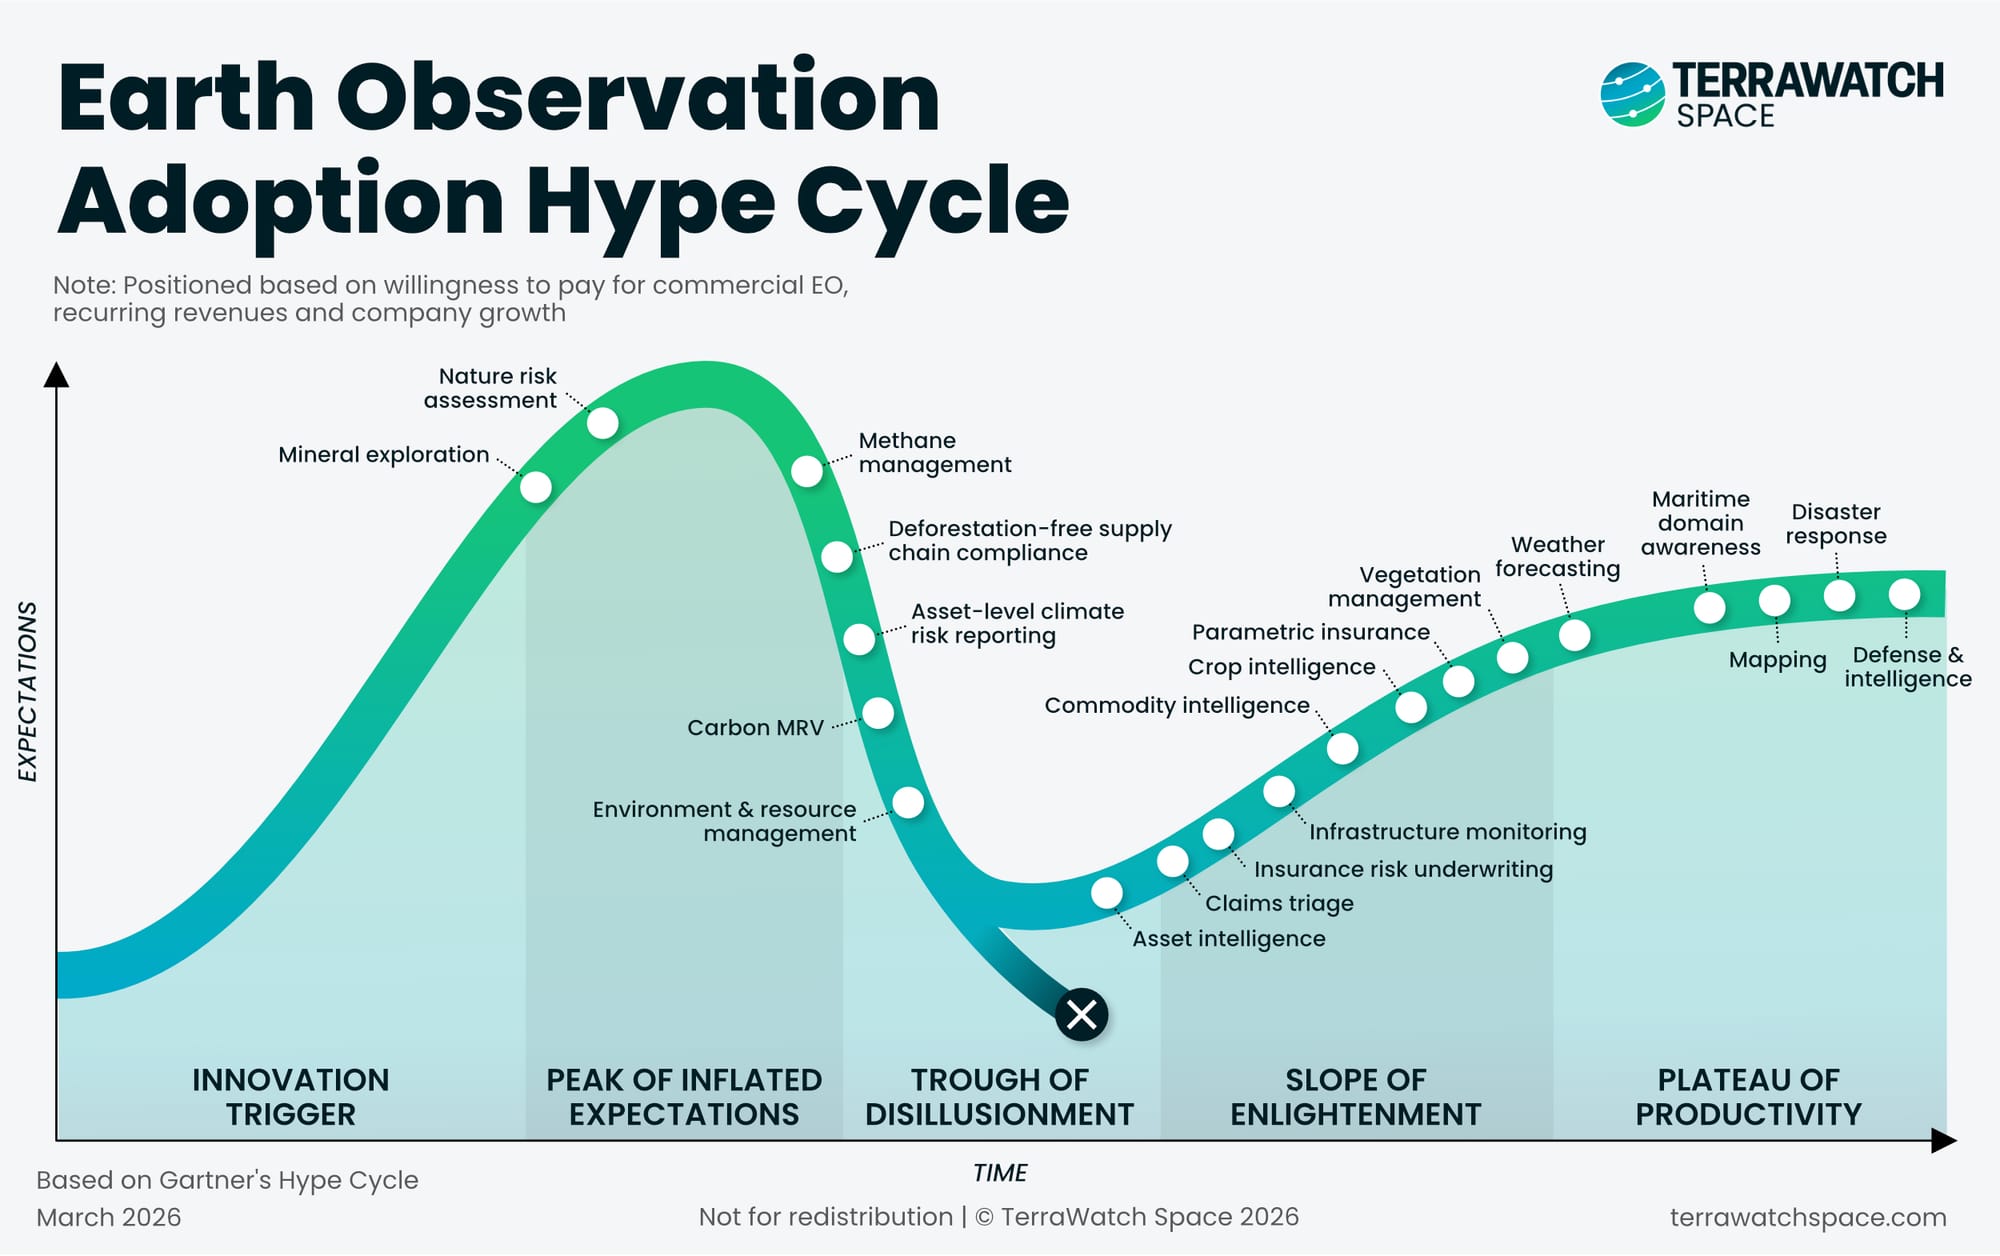
Keep in mind: Not every use case on this chart will reach the plateau, not because of a product or adoption failure. For some, open data from Sentinel, Landsat, and Copernicus is sufficient for what the buyer needs. Commercial satellite data adds precision, resolution, or timeliness, but for certain use cases the free alternative is already good enough. These use cases may move along the curve, but the ceiling for commercial EO adoption is structurally lower.
Two Main Takeaways from the Hype Cycle
First, the use cases that have reached the plateau of productivity are almost all government-anchored: defence and intelligence, disaster response, maritime domain awareness and mapping. These verticals did not "cross the chasm" the traditional way. They were built into government operations from the start, funded by public budgets, driven by institutional mandates.
Another pattern is just as revealing: the innovation trigger is empty. Despite the wave of new satellite constellations with new sensors, and the rapid emergence of AI and foundation models for EO — no genuinely new commercial EO use cases are forming. While these advances are real and significant, the main takeaway is that most advances make existing use cases better and more viable. Hyperspectral data makes mineral exploration more precise, high-resolution SAR improves infrastructure monitoring, AI accelerates analytics across the board and so on.
The EO industry's challenge is clearly not a shortage of things it can do; it is converting what it can already do into something buyers operationally and repeatedly pay for.
So what does this chart actually tell us? Actually not a lot. The hype cycle is a useful snapshot of where industry attention sits. But as a tool for understanding EO adoption, it has a fundamental problem. In other words, after showing you the chart, I am telling you that is not very useful or sufficient at all.
The Hype Cycle Is Not Good Enough
The hype cycle shows you where use cases sit. What it cannot show you is why they sit there, or what it would take to move them.
Use cases that sit at the same position on the curve can be there for completely different reasons. One might be stuck because its market collapsed. Another because its product never moved beyond bespoke project delivery. Another because the buyers it targets adopt new technology slowly. Same position, different problems, different paths forward.
The same is true for use cases that are gaining traction. Some are succeeding because they replace something expensive the buyer was already doing. Others because regulation is forcing adoption, and others because a few companies figured out how to build a product that fits into the buyer's existing workflow. Same part of the curve, different reasons for being there.
The hype cycle tells you where, but it does not tell you why. And without understanding the why, you cannot figure out what to do next — whether you are building an EO product, investing in an EO company, or trying to adopt EO inside your organisation.
For that, you need a different lens. One that explains the mechanism behind EO adoption, and why most of what the industry calls a "use case" is not one.
The most recent analysis piece, "The Anatomy of an EO Use Case" dives deep into what constitutes an EO use case, the role of AI in moving through the cycle, what the successful use cases have in common and more.
Upgrade to a Premium subscription to read the full deep-dive!
🔍 Recommended Reads
Interesting links to check out
- This research from ESA suggests that emissions from the wildfires in the Amazon in 2024 may have been up to three times higher than earlier estimates.
- This piece that looks into the concerns of humanitarian organisations and journalists after Planet announced restricted access to its imagery.
- This article from Bellingcat that explains how their open source tool for damage assessment works, leveraging SAR data from Sentinel-1 satellites.
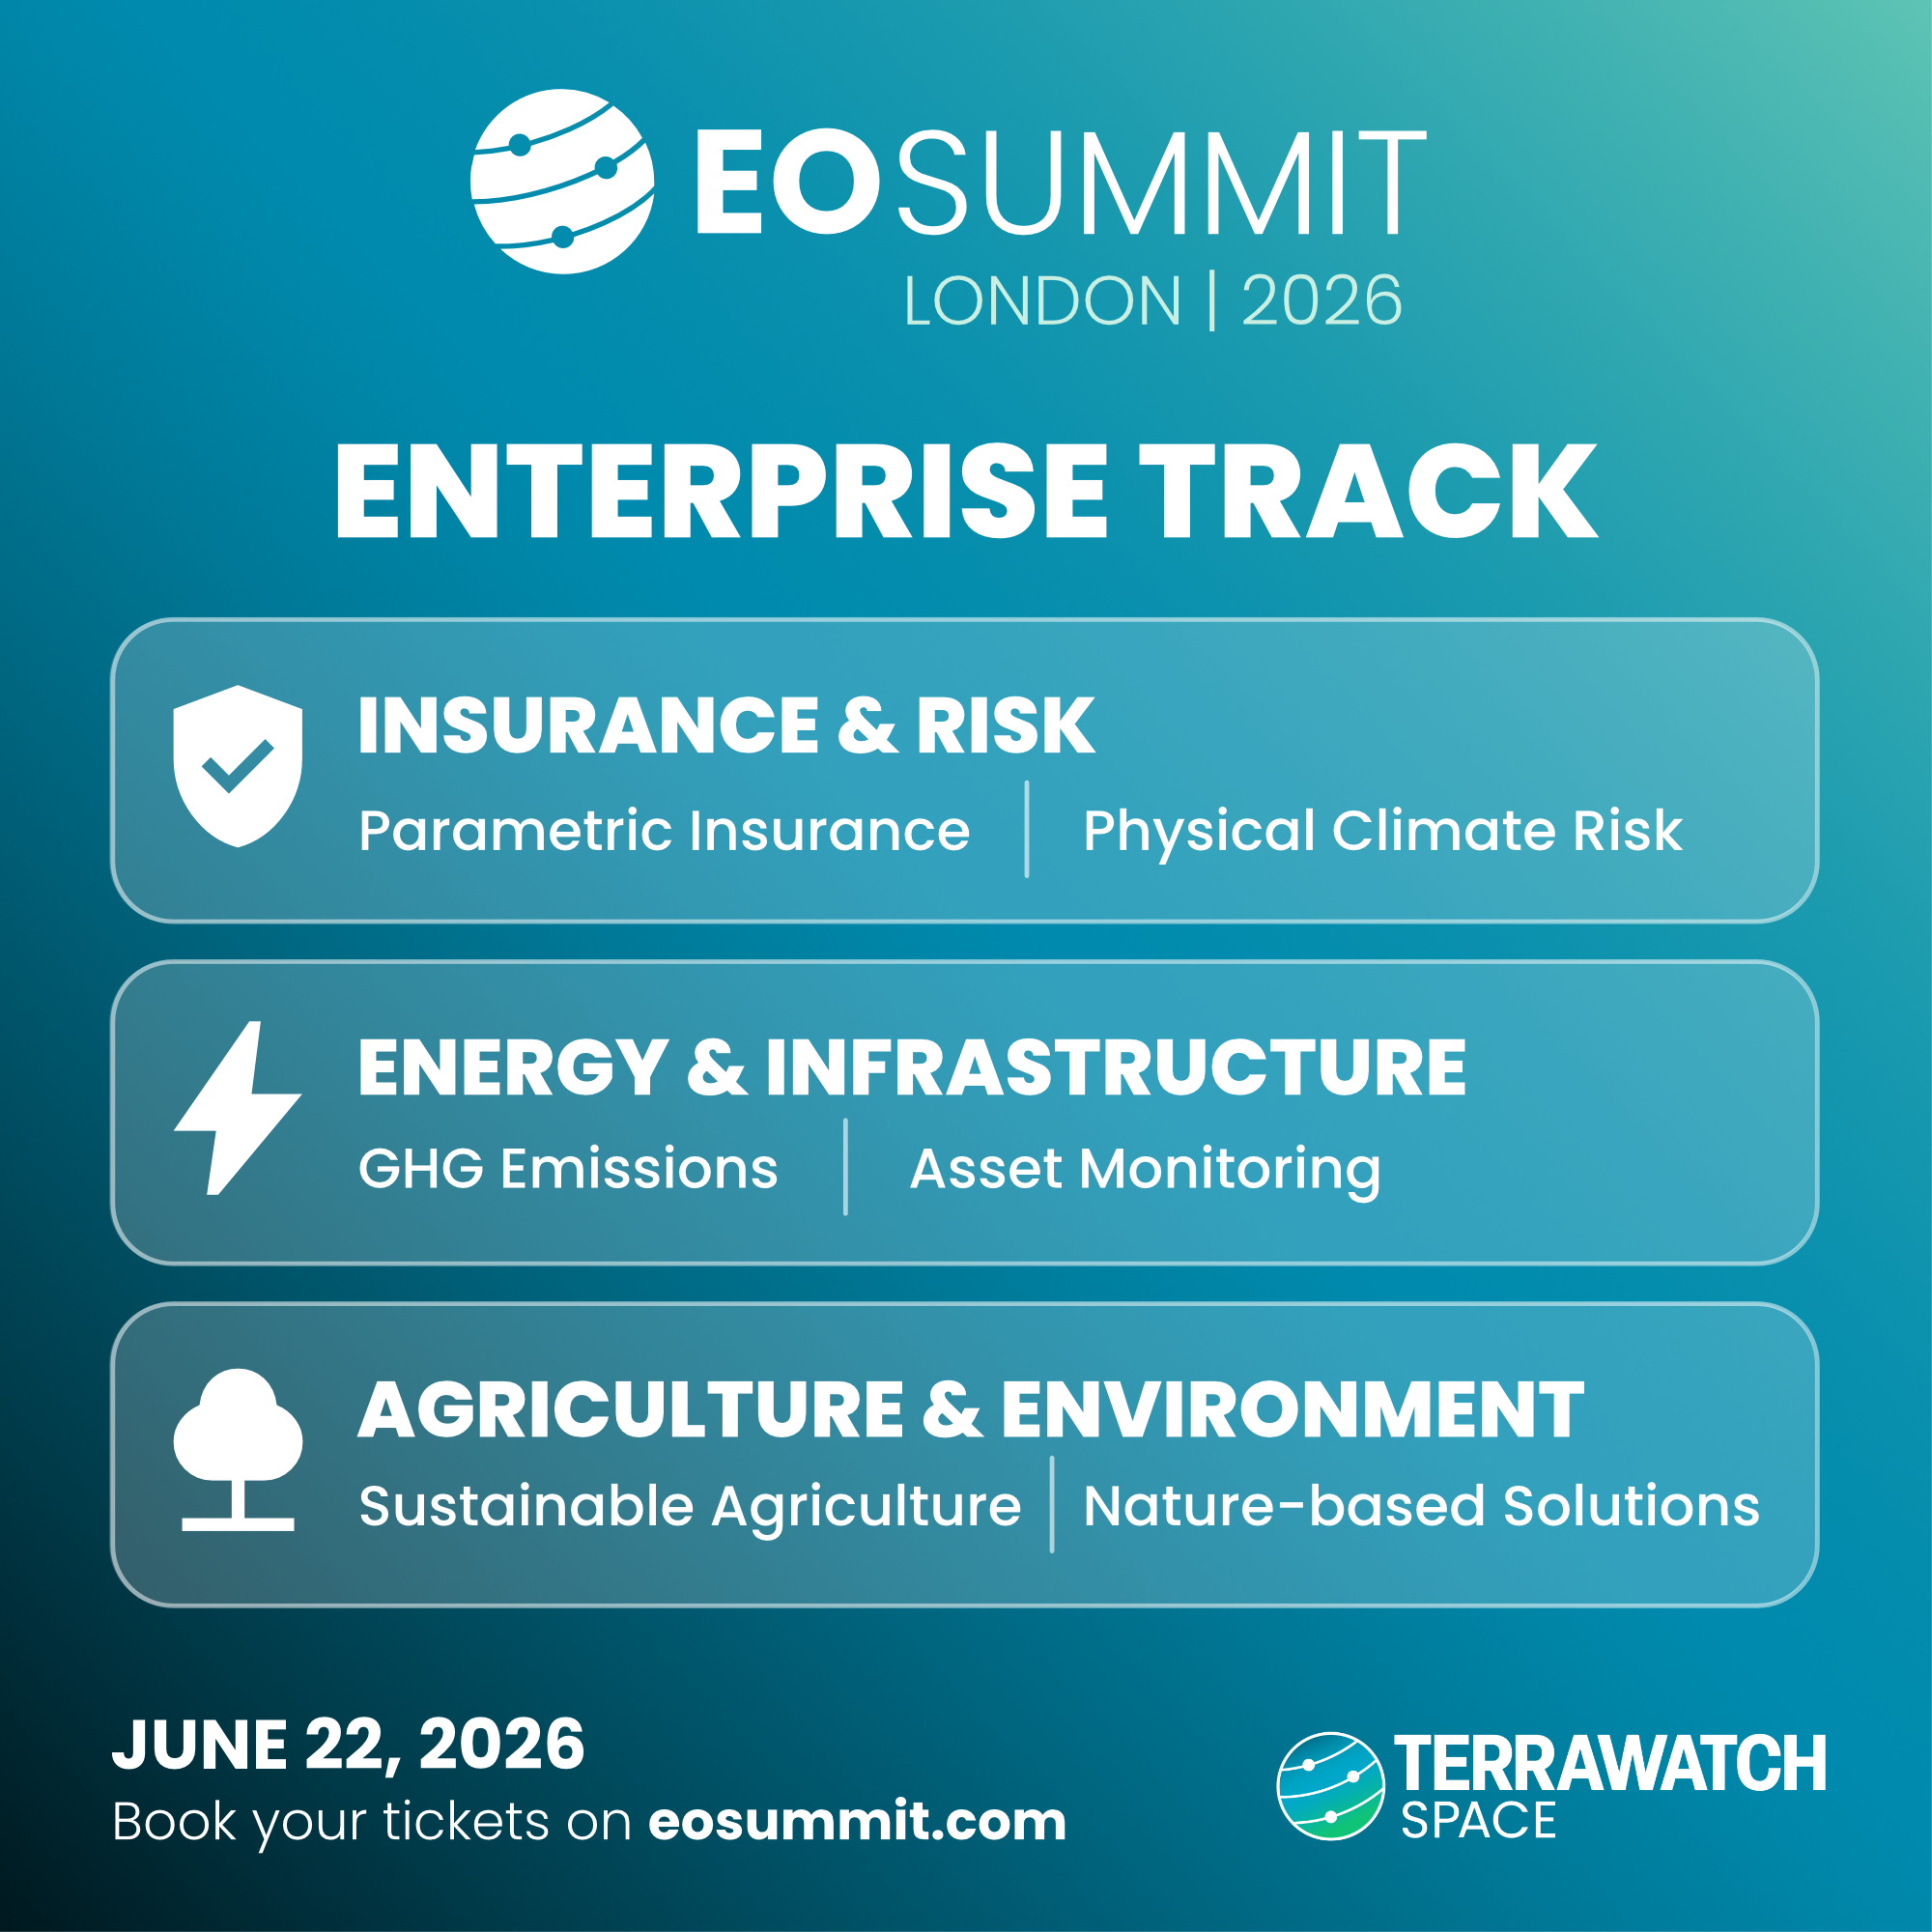
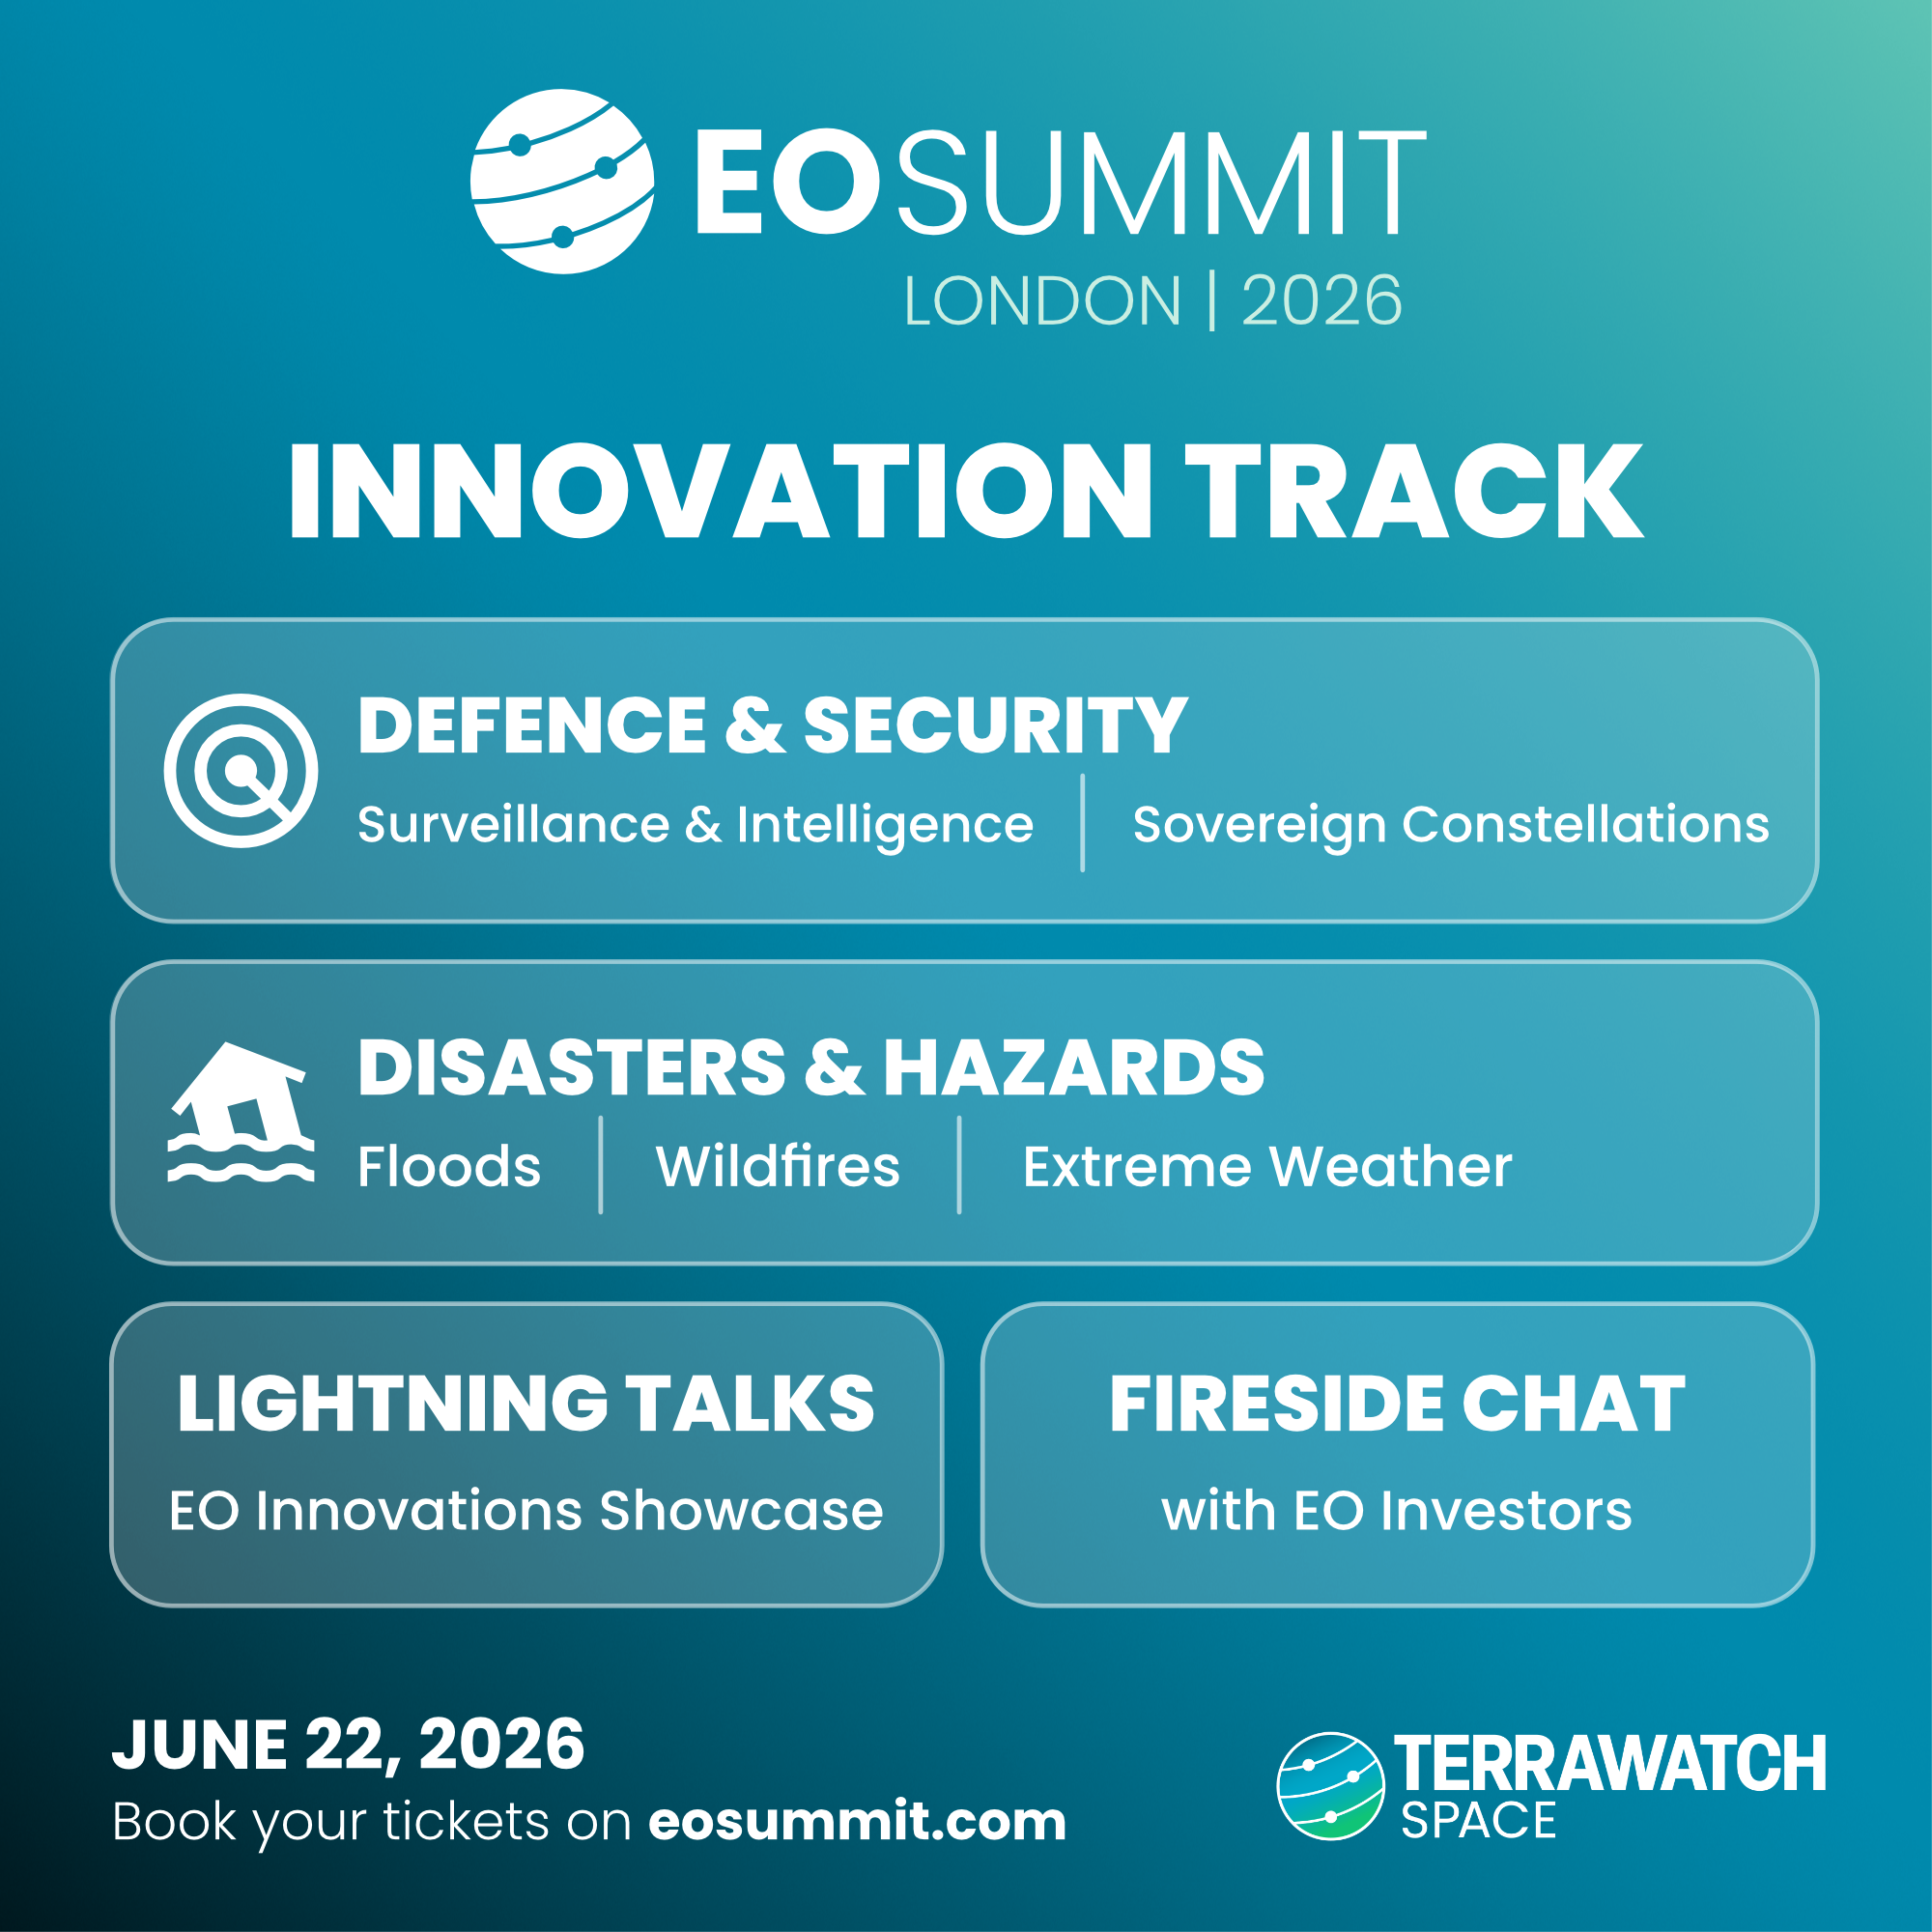
EO Summit: Enterprise Track and Innovation Track
This year's EO Summit will have two tracks – the Enterprise Track focused on mainly on commercial applications of EO, and the Innovation Track focused on new innovations for civilian and defence applications of EO.
The Enterprise Track will include 3 thematic blocks: Insurance & Risk, Energy & Infrastructure and Agriculture & Environment – each session will have two presentations from enterprise users and two panels with a diverse panel group.
The Innovation Track will consist of sessions on EO for Defence & Security and EO for Disaster Management. This will be followed by Lightning Talks to showcase emerging EO innovations and then conclude with an investor fireside chat.
🛰️ Scene from Space
One visual leveraging EO
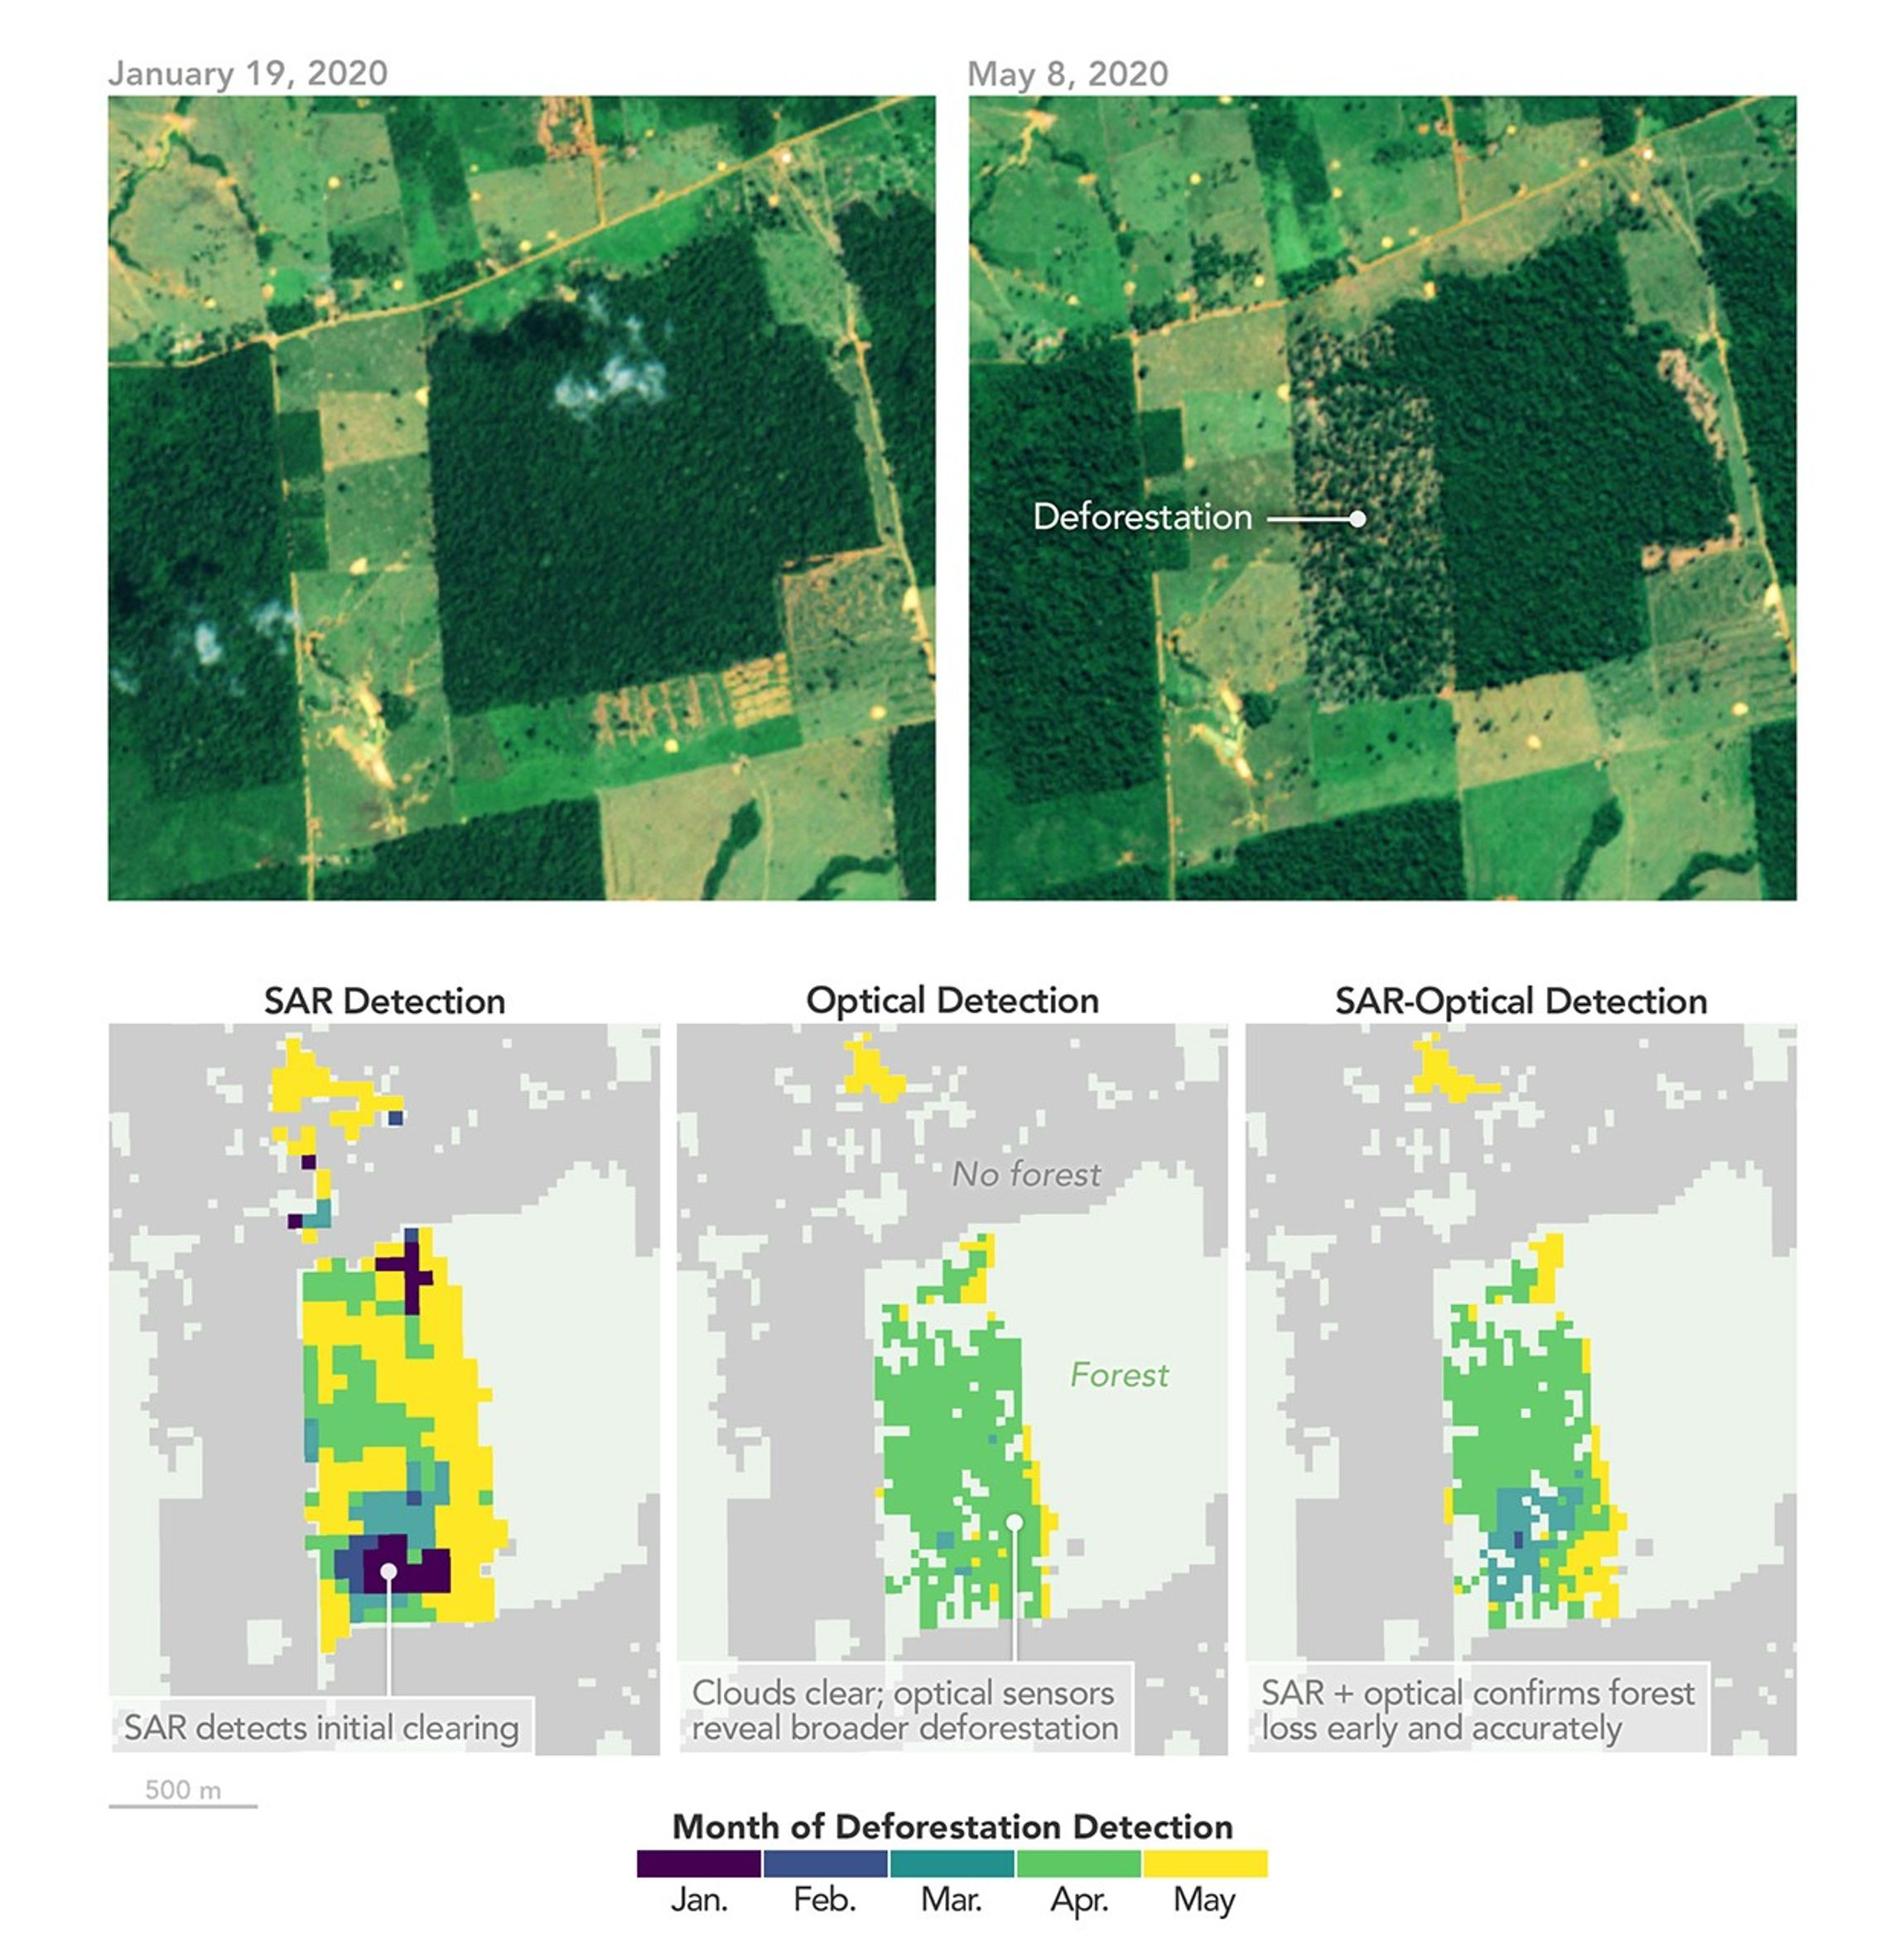
Combining Optical + SAR Data for Faster, Accurate Deforestation Tracking
NASA has recently developed a new method for tracking tropical forest loss that delivers deforestation alerts more than three months faster than current methods. Though Landsat and Sentinel are critical for deforestation monitoring, the limitation is clouds.
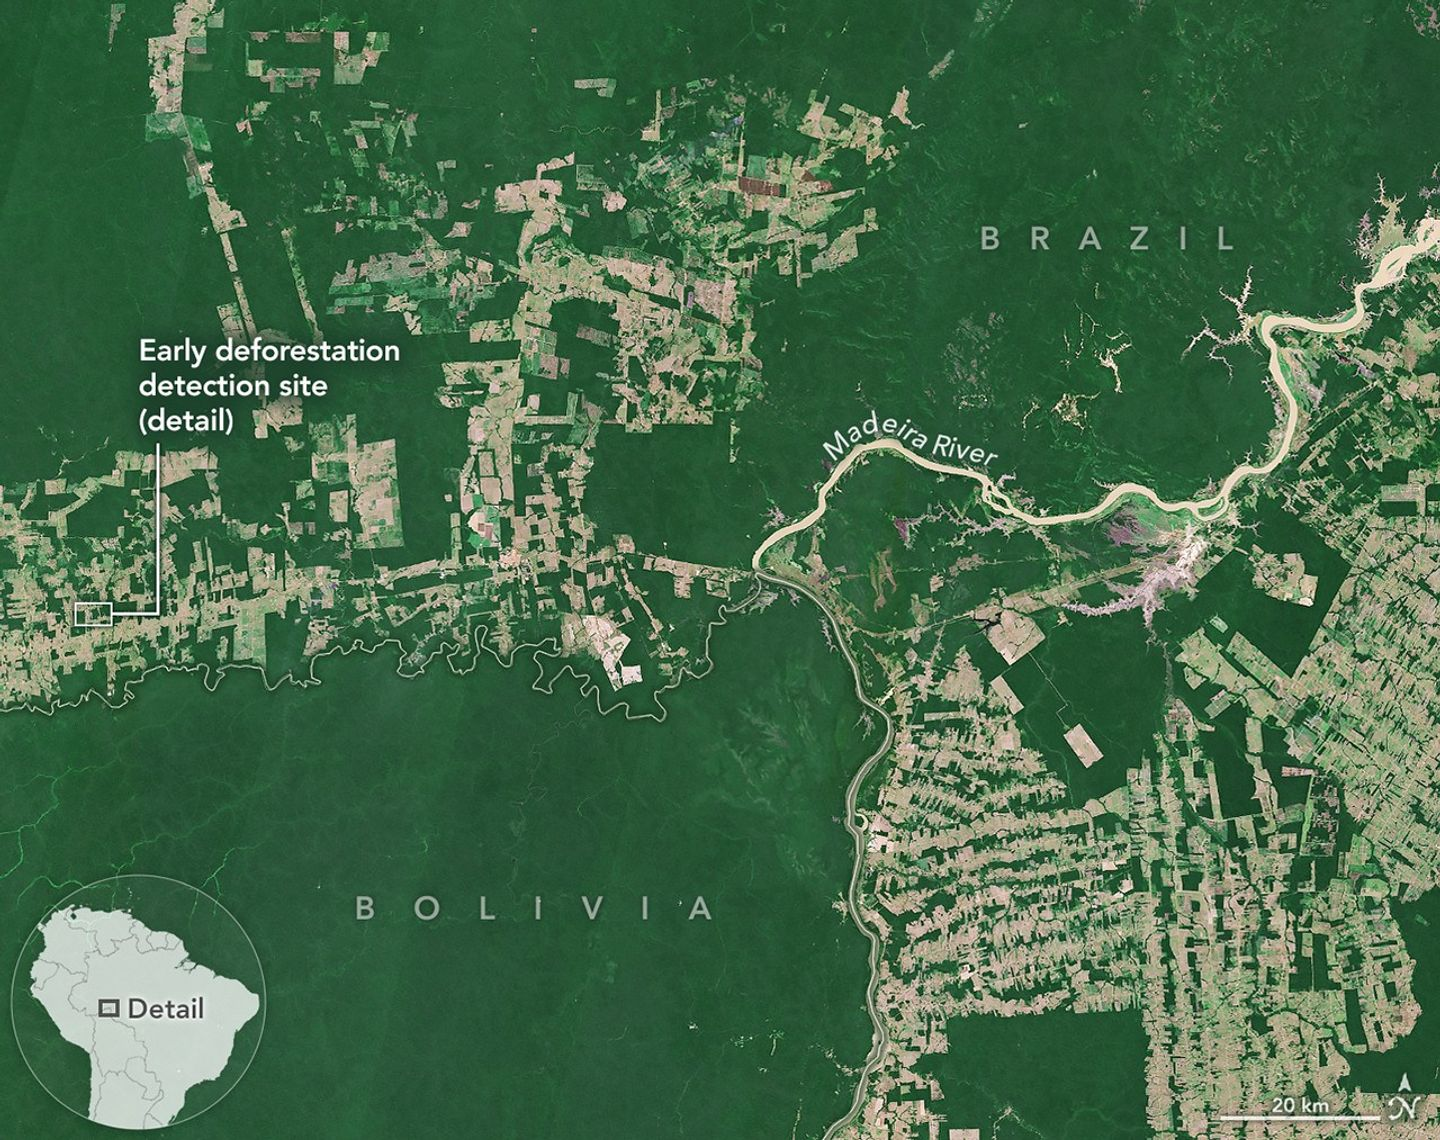
The recently launched NISAR satellite, with L-band SAR instrument is capable of picking up details that other SAR satellites miss or lead to false alarms. Using a combination of optical and SAR means that trees felled can be caught in real-time, with added accuracy.
The image below from NASA show a demonstration of that.
Until next time,
Aravind.


