

Welcome to the first 2026 edition of Earth Observation Essentials, the free biweekly newsletter from TerraWatch covering key highlights from the EO market along with insights and analysis.
If you would like a more detailed, comprehensive market briefing with exclusive analysis, delivered every week, become a Pro subscriber, or a Premium subscriber, for more deep dives on EO markets, technologies and applications.
📈 EO Market Highlights
Major developments in EO
🔥 Thermal infrared-based wildfire monitoring firm OroraTech has entered into a multi-year partnership with Kepler to integrate its instruments in Kepler’s new optical communications constellation, which will enable near-real-time monitoring of selected areas of the planet.
🛰️ Iceye and Planet signed multi-year, multi-million sovereign EO deals with Sweden while Satellogic was awarded a contract from Portugal for delivery of two EO satellites.
🌥️ Tomorrow.io unveiled plans for its next generation of multi-sensor weather satellites for real-time space-based atmospheric and oceanic sensing to enable real-time, AI-driven weather forecasting. In the meantime, EUMETSAT is going ahead with its plans for a constellation of polar-orbiting weather satellites.
🤝 AXA Digital is teaming up with Iceye use its SAR data to track floods, wildfires, hurricanes, and other extreme weather events.
In the Pro newsletter, we covered the Three Winning Factors for EO Application Firms and the State of Sovereign EO Programs.
Upgrade to a Pro subscription to receive exclusive insights and analysis.
💡 Insight Bytes
A quick dose of analysis from TerraWatch
Reviewing Earth Observation Investments in 2025
The total EO investments in 2025 reached $2B, the highest annual figure on record, representing a 15% increase from 2024 and even surpassing the 2023 peak. Two segments (Acquisition and Intelligence) accounted for over 90% of all funding, but the other one (Processing) seems to have finally picked up.
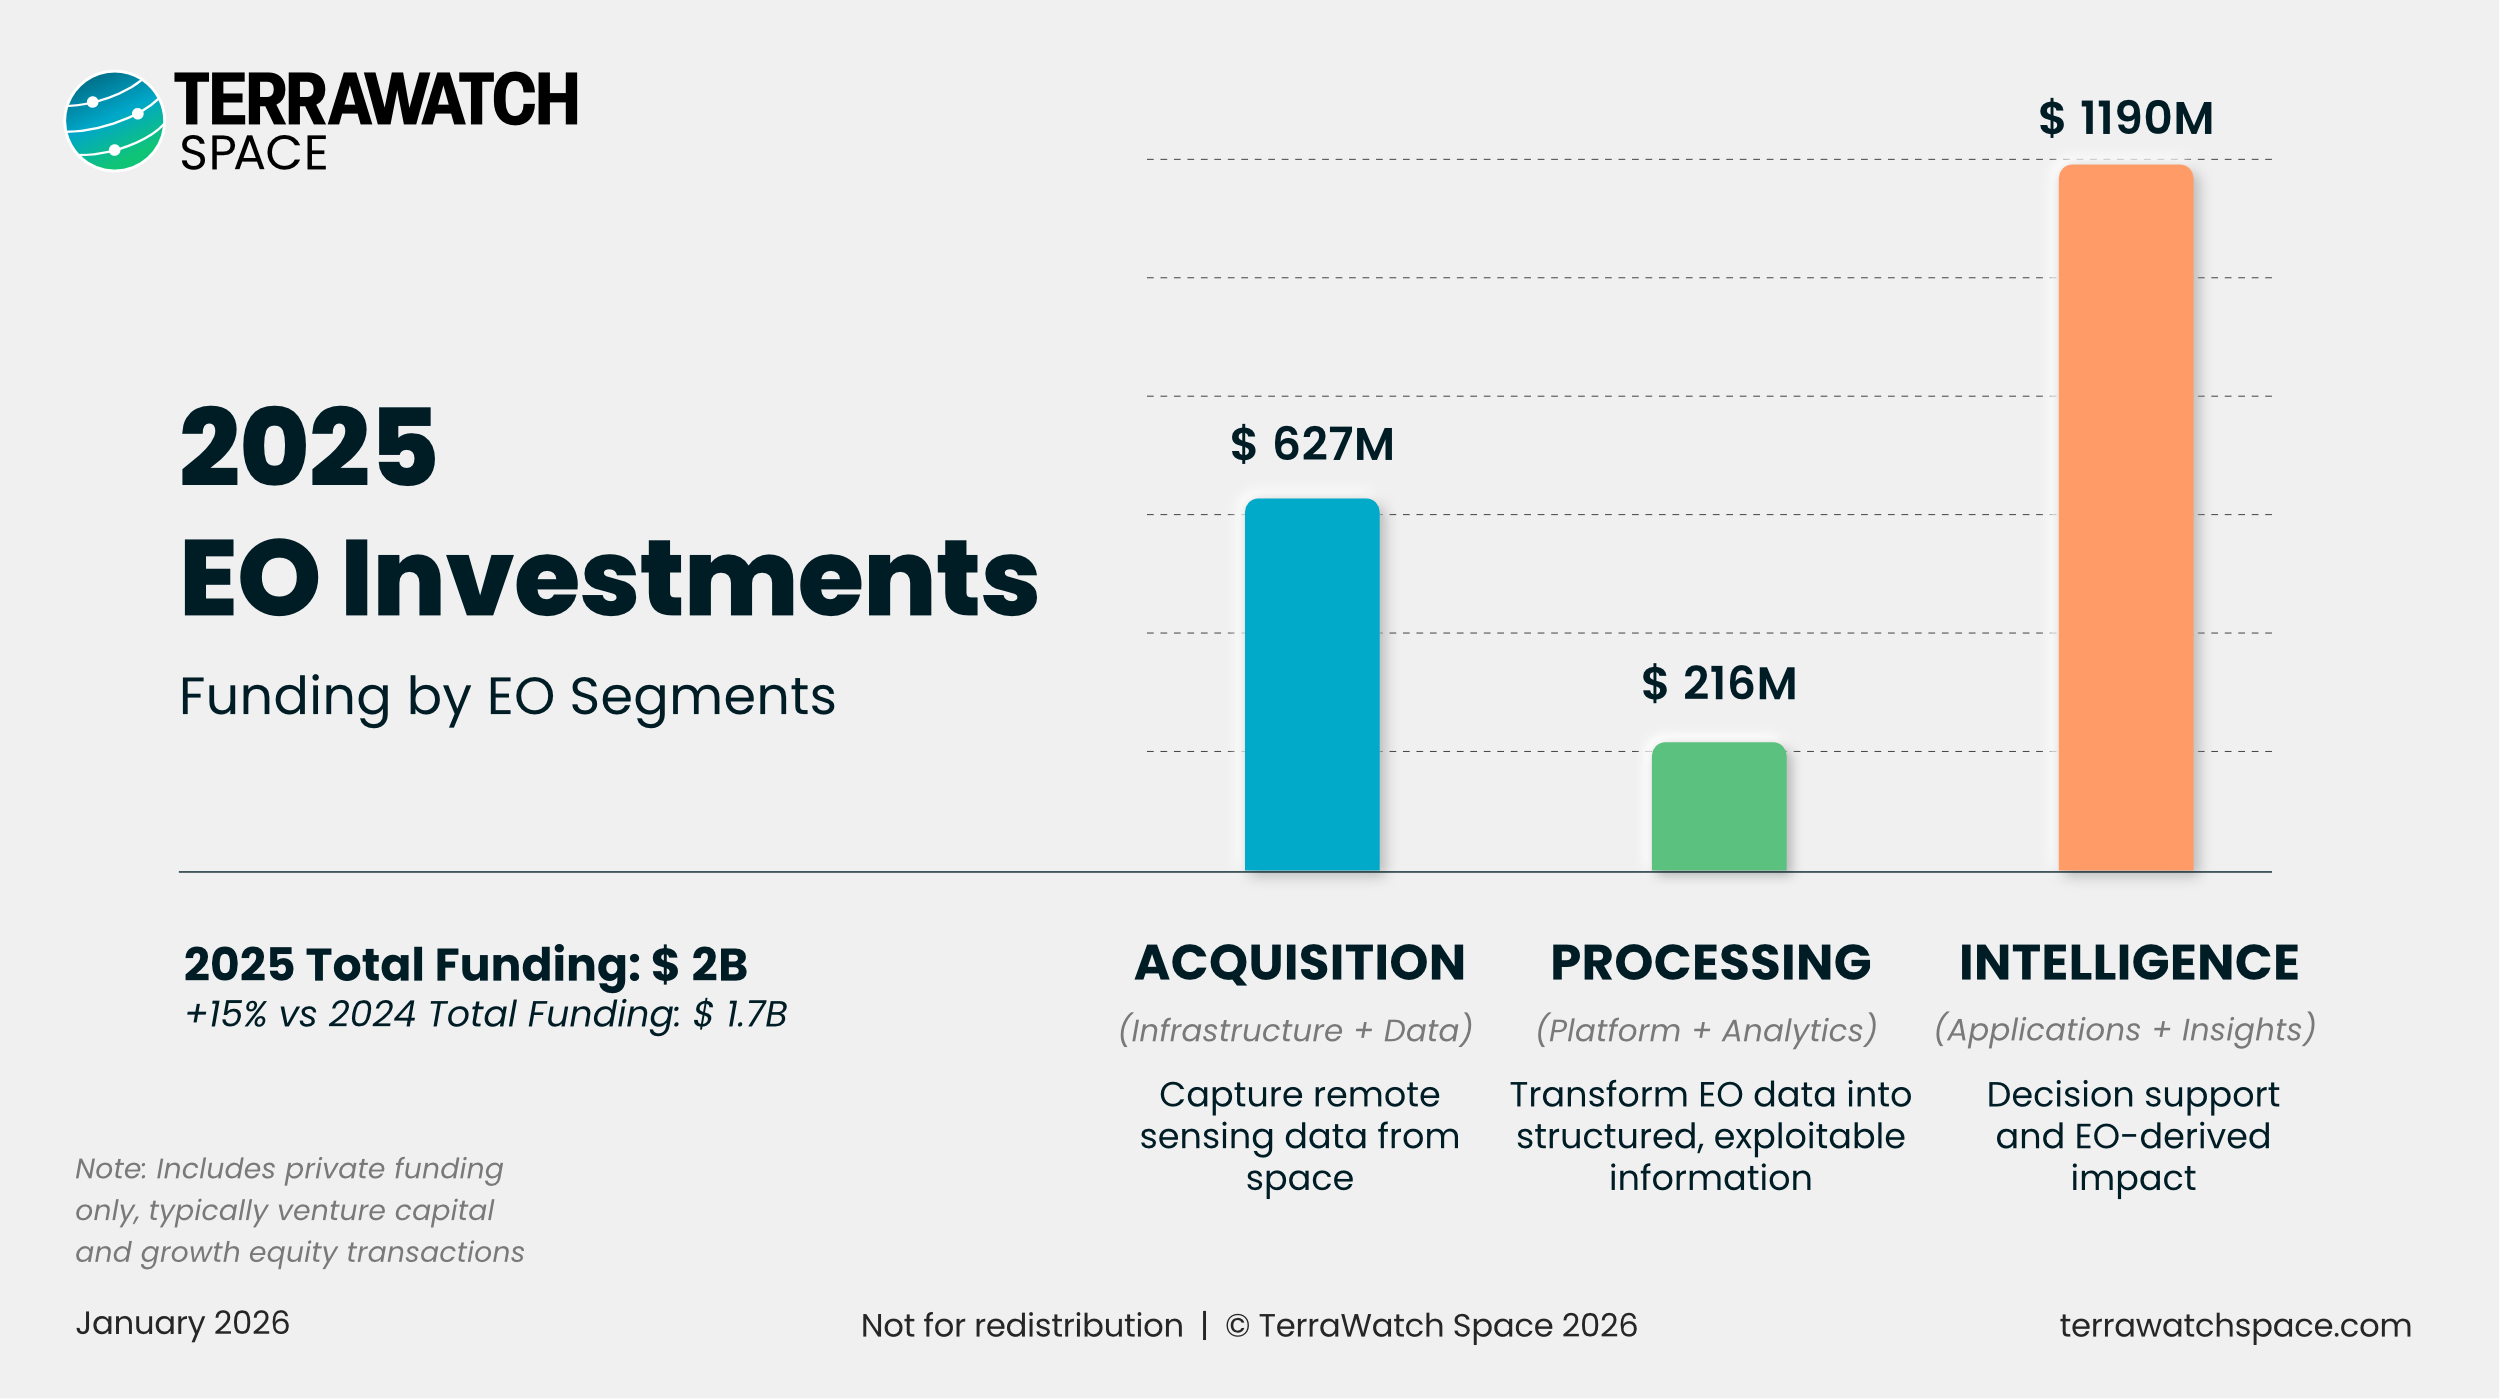
The upstream EO companies (Acquisition layer) continued attracting capital, but without the mega-rounds of previous years – remained flat might be the wrong way of putting it, stable might be better.
The Processing (aka "boring middle") layer that historically attracted less than 10% of EO funding, had their funding more than double in 2025.
Intelligence remained the largest segment, as expected, although climate-focused EO companies faced headwinds, while those that focused on insurance, utilities, and energy sectors continued their steady fundraising.
The full piece breaks down EO investment in 2025: by segment, by year, by region, and by growth stage. We will look at the largest rounds, what they signal about investor conviction, what kind of M&A happened in EO and what it all could mean for the year ahead.
Become a Premium subscriber to read the full analysis.
EO Summit 2026
EO Summit is back – this year in London. We are going with a focused one-day format, with two parallel tracks:
🏢 Enterprise track focusing on commercial EO applications: Insurance & Risk, Energy & Infrastructure, Agriculture & Environment
🏛️ Disasters track focusing on government/public sector EO applications: Floods, Wildfires & Early Warnings
Sponsorship and registrations are now open at eosummit.com.

🔍 Recommended Reads
Interesting links to check out
- This article from CNES that explains how 3D models are created using satellite data from missions such as the CO3D mission.
- This article that explains why ground validation is now a critical bottleneck for the new wave of spaceborne hyperspectral sensors.
- This article that details why and how Sentinel-2 mission is exploring acquiring night time imagery, as a targeted experiment to support the definition of the Sentinel-2 Next Generation satellite.
🛰️ Scene from Space
One visual leveraging EO
Fires in the Arctic
Satellite data show that wildland fires once scattered across the Arctic are now surging in numbers, some burning more intensely than before.
The maps below from NASA show the number of fires detected by the MODIS sensors on NASA’s Aqua and Terra satellites – the map on the left shows fire detections from 2002 to 2012 (yellow), while the map on the right shows detections from 2012 to 2024 (orange).
Until next time,
Aravind.


