

Welcome to a new edition of Earth Observation Essentials, the free biweekly newsletter from TerraWatch covering key highlights from the EO market along with insights and analysis.
If you would like a more detailed, comprehensive market briefing, delivered every week, become a Pro or Premium subscriber.
📈 EO Market Highlights
Major developments in EO
🤝 Albedo is exiting the commercial imagery business to focus entirely on building VLEO satellite buses for others, after discovering its hardware side offers more strategic value than flying its own constellation.
Until downstream applications and commercial adoption catch up, even technically differentiated players will struggle to turn pixels into predictable revenue. In the meantime, as the market has already showed, selling EO infrastructure remains the short-term growth fix.
💰 The US Space Force awarded Muon Space a contract worth $45M for providing cloud-based weather data products in support of military applications, using the same satellites that are part of the wildfire monitoring FireSat constellation, leveraging proprietary payloads with enhanced spectral coverage.
📣 Maxar has officially split into two companies: Maxar Intelligence is now Vantor, and Maxar Space Systems becomes Lanteris post-acquisition. Vantor is positioning itself as a “spatial intelligence” business, combining imagery, 3D modeling, and data fusion rather than just a pure satellite imagery provider.
In the TerraWatch Pro newsletter, we covered the difference between technology-led EO and problem-led EO, why Maxar's rebrand is not a big deal and why Muon's approach could be a breakthrough.
Upgrade today for more in-depth analysis!
💡 Insight Bytes
A quick dose of analysis from TerraWatch
Earth Observation for Climate Adaptation
EO is a critical enabler for climate adaptation, providing independent, scalable, and globally consistent data, allowing us to detect risks, track impacts, and measure resilience in ways that other methods cannot.
But EO’s role in climate adaptation is often described in vague terms. To bring clarity, we classify its contributions along two axes: preparedness vs. responsiveness and short-term vs. long-term.
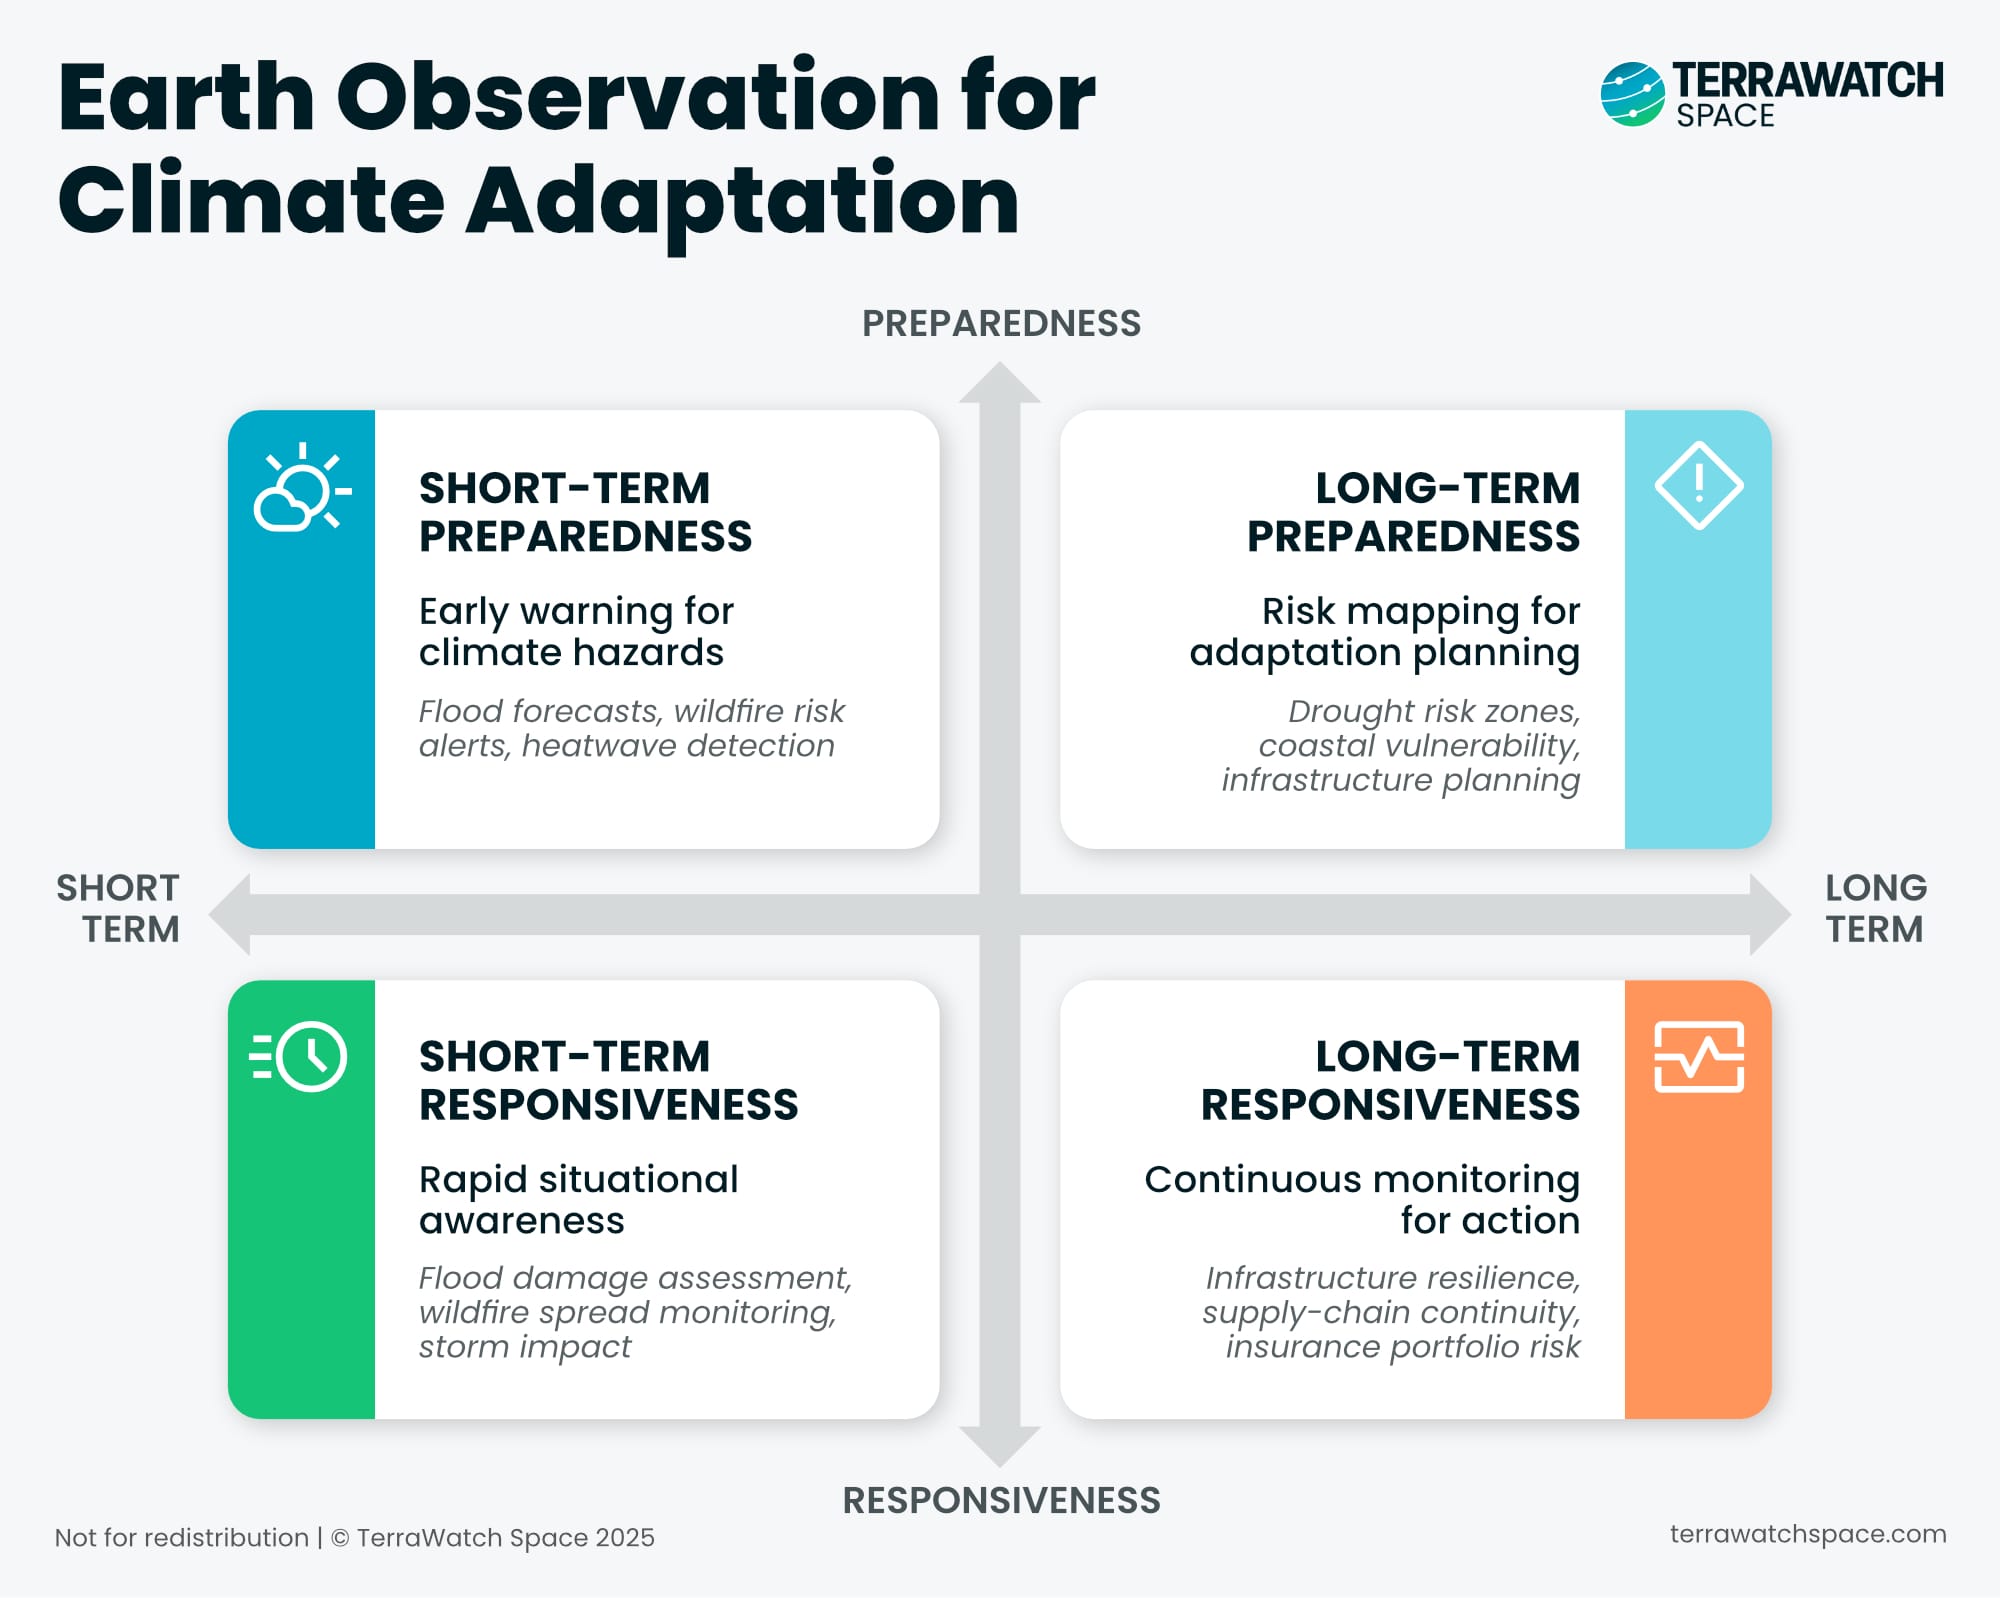
The framework shows how EO supports early warnings, situational awareness, risk mapping, and continuous monitoring, each distinct in purpose but complementary in impact.
Preparedness functions focus on anticipating risks and informing adaptation planning, while responsiveness functions enable rapid reaction and ongoing adjustment to climate shocks.
The takeaway is that EO is not just about “monitoring climate change.” Its real value lies in enabling different types of decisions – before, during, and after climate events, across both immediate crises and structural adaptation. To be effective, strategies must integrate EO across all four quadrants, not just focus on one.
The next exclusive deep-dive for the Premium subscribers of the newsletter will be the "State of Earth Observation: 2025 Edition", to be sent out on October 22.
Upgrade to the Premium tier to receive your copy!
🔍 Recommended Reads
Interesting links to check out
- This piece that discusses how a new program that uses satellite imagery is raising pressure on avocado growers on deforestation, pressuring them to stay compliant.
- This article that dives into how energy firms are rushing to procure weather services to gain a trading edge in Japan.
- This technical deep dive into an open-source pipeline to detect potential war crimes from satellite data, in this case burning of civilian homes.
🛰️ Scene from Space
One visual leveraging EO
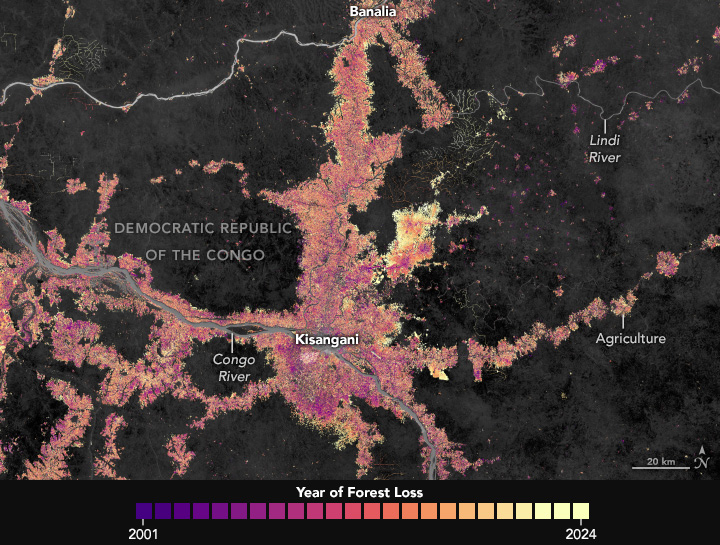
Forest Loss in the Congo Basin
The Congo Basin, Earth’s second-largest rainforest, has lost over 8% of its cover since 1990. In the DRC alone, which holds two-thirds of the basin, 74,500 km² (28,800 mi²) have disappeared since 2002 – an area the size of Austria.
Around Kisangani, a city of 1.5 million, forest loss is particularly visible. The map below from NASA, derived from over two decades of Landsat imagery, highlights where deforestation occurred between 2001–2024, with older losses shown in purple and pink and more recent losses in orange and yellow.
Applications like this show the importance of long-term, high-quality and consistent datasets like Landsat.
Until next time,
Aravind.


