

Welcome to a new edition of Earth Observation Essentials, the free biweekly newsletter from TerraWatch covering key highlights from the EO market along with insights and analysis.
If you would like a more detailed, comprehensive market briefing, delivered every week, become a Pro or Premium subscriber.
📈 EO Market Highlights
Major developments in EO
💻 Google, which first introduced Earth AI in July 2025, has now expanded access through Gemini and Google Cloud, bringing the global geospatial model closer to external users and applications.
This standardization is making the traditional EO "platform layer" redundant. Developers can soon plug directly into Earth AI, instead of building data pipelines from scratch. This development challenges some EO companiem: specialize in unique datasets or problem-driven solutions in specific verticals.
Yes, but: Earth AI's global model will trade precision for coverage, so there will be room for regional or domain-specific players.
Bottomline: Google is trying to give a new definition for what “usable” geospatial intelligence looks like: integrated, searchable, and instantly queryable.
💰 Open Cosmos was selected by ESA and the Spanish Space Agency to build the Spanish component of the Atlantic Constellation, which will consist of 8 satellites with a high-resolution multispectral imager, a GNSS-R sensor, an AIS receiver, and an IoT sensor.
🛰️ Satellogic announced the launch of its newest very high-resolution satellite platform based on a non-ITAR design with 30 cm resolution and onboard processing, with the first satellite expected to be operational in 2027.
In the Pro newsletter, we covered Implications of NGA's Luno Program on the EO Sector, Impacts of the Merger of Airbus-Thales-Leonardo for EO in Europe and What EO Can Learn from Cloud Computing about Adoption.
Upgrade to the Pro tier today for more exclusive insights!
💡 Insight Bytes
A quick dose of analysis from TerraWatch
EO for Wildfire Monitoring
Wildfires have existed for as long as plant life has existed on Earth. Not all fires are destructive – wildfires help clear nutrients in the soil and open access to sunlight while killing certain problematic insects and diseases. Some tree and plant species even depend on the heat from a fire to open up their seeds. This is why fire experts and land managers set fires to existing ecosystems under specified weather conditions to restore health to ecosystems that depend on the fire.
But when they get out of control, wildfires can become dangerous - costing the US economy between $394 billion and $893 billion annually, beyond immediate wildfire damage, including impacts to real estate value, premature deaths, and health risks from wildfire smoke, threats to watersheds; and income loss.
Wildfires develop where there is available combustible vegetation and an ignition source, such as from lightning strikes or human activity, accidental or intentional. While roughly four out of five wildfires are started by people (varies by country), dry weather, droughts, and strong winds - all impacted by climate change - transform a spark of fire into wildfires consuming tens of thousands of acres.
The Fire Behaviour Triangle
Wildfires represent a complex, multiscale problem: a combination of biological, meteorological, physical, and social factors influencing their likelihood, behaviour, duration, extent, and outcome. As a result, the infrastructure to monitor fires also requires a multimodal solution, from connected sensors and cameras on the ground to satellites in multiple orbits.
If you are wondering what we really observe, when we say we use EO to "monitor wildfires", the fire behaviour triangle provides a good framework to help identify the key variables that affect how a wildfire behaves.
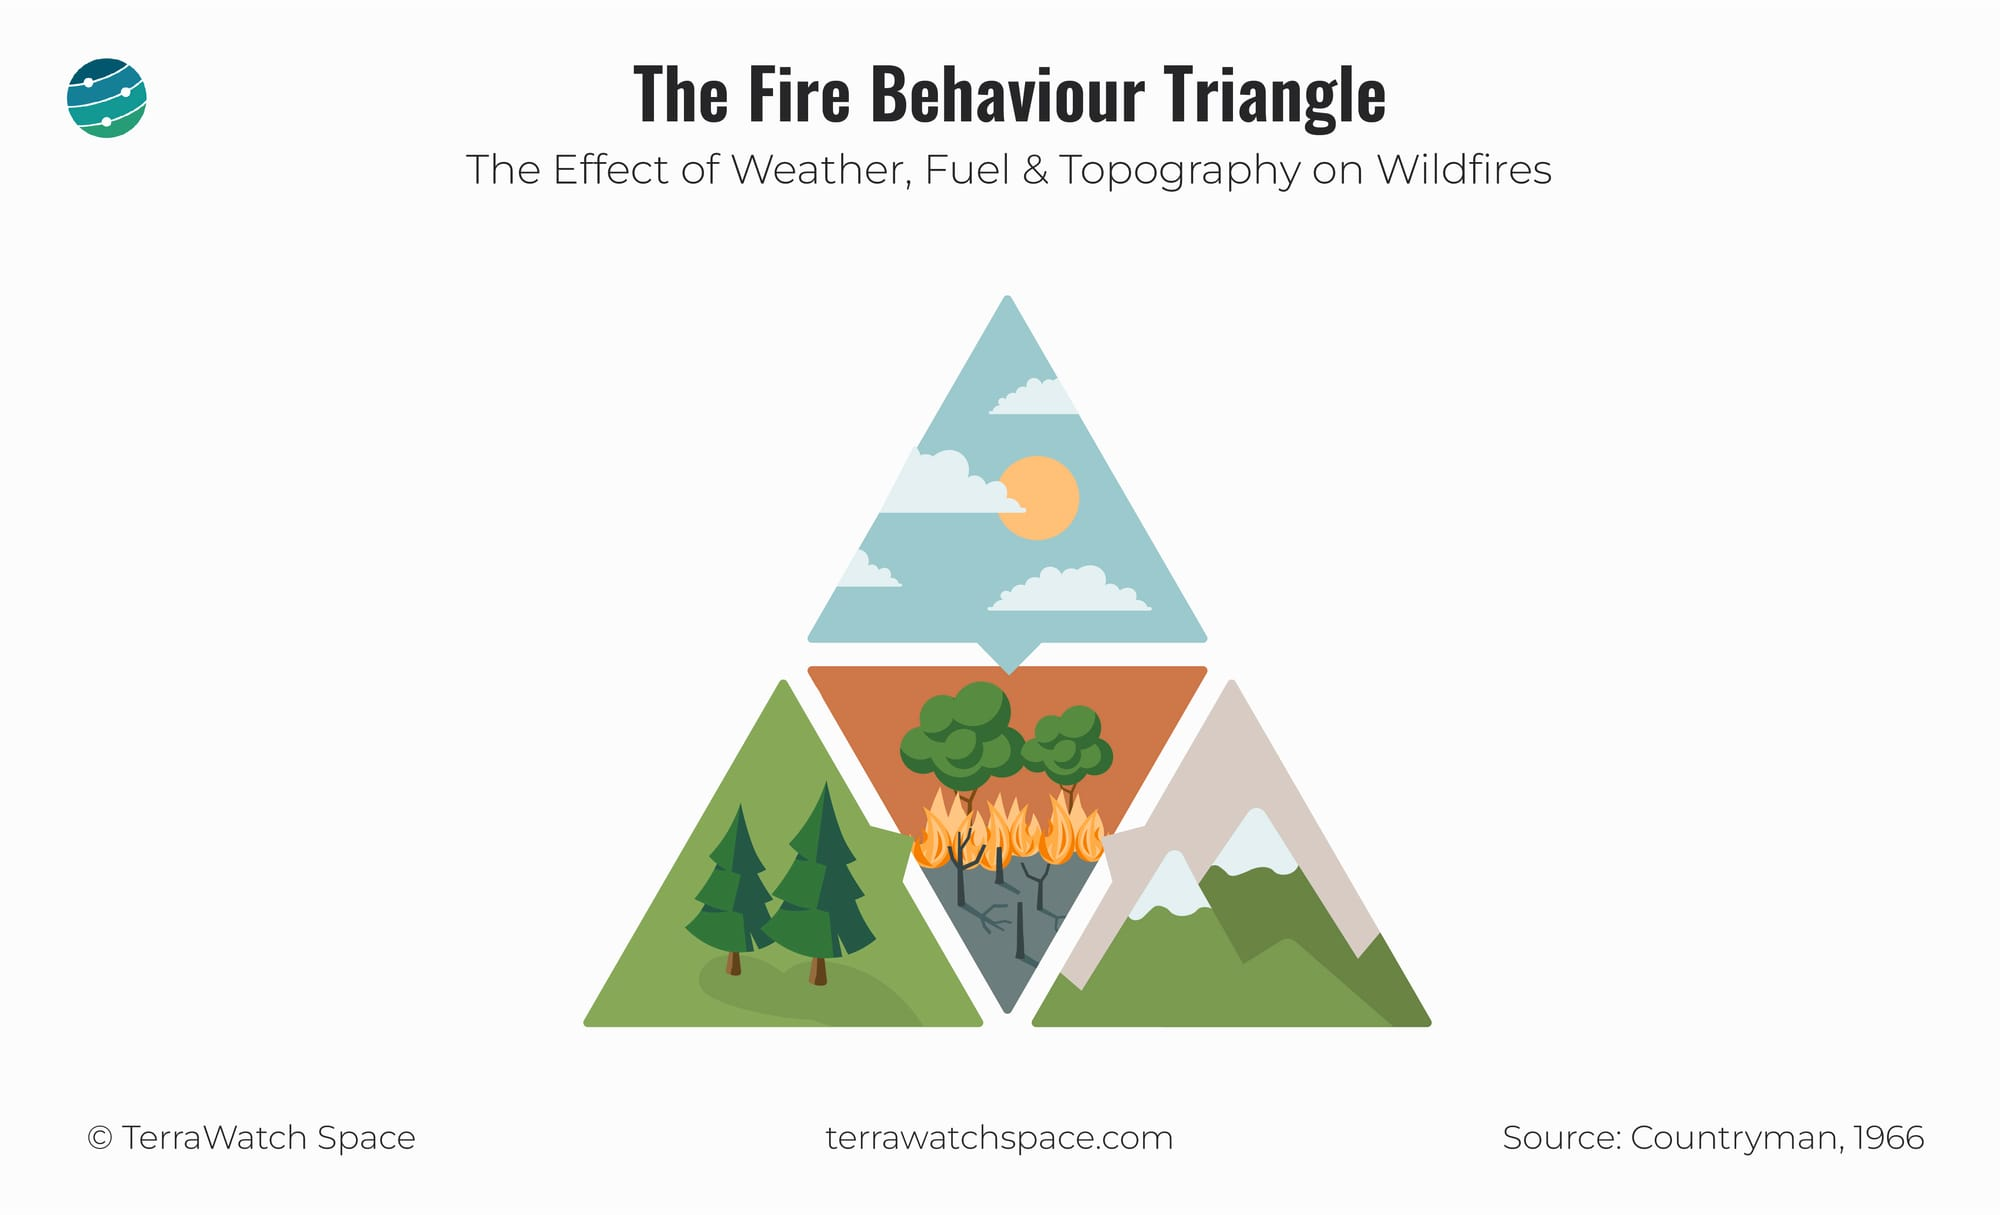
Fuel is anything that burns, including both live and dead vegetation, from plants and trees to leaves and saplings. Weather indicators and topographic conditions affect how fast fires spread.
These three variables determine a fire's behaviour - speed, direction, and flame characteristics and intensity, which can be classified into 14 indicators.
Upgrade to the Premium tier to read the full deep dive and learn more about the 14 wildfire indicators, how satellites are used to track them, and the market for EO-based wildfire monitoring.
With a Premium subscription, you receive monthly deep dives on EO use cases, market trends, technology advancements and strategic frameworks + get access to all archived content.
The next deep dives are The Future EO with Edge Computing and The Invisibility Curve: A Framework for EO Adoption.
The 2025 Edition of the State of Commercial EO is Live!
The report is a consolidation of our research and our frameworks and includes everything you need to know to stay updated about the EO sector.
- Context: EO's evolving global landscape,
- The EO Value Chain: How EO moves from satellites to analytics and applications,
- Acquisition: EO satellite projections, national EO constellations and EO commercial landscape,
- Processing: Platforms, analytics, embeddings and foundational models,
- Intelligence: Insights vs applications and understanding EO use cases,
- EO Market Trends: Investment patterns, market size projections, and institutional EO budgets,
- EO Adoption Trends: Evolving user personas and key adoption drivers across industries,
- Outlook: Problem-driven strategies, AI and EO, and government dominance.
🔍 Recommended Reads
Interesting links to check out
- This study showing how integrating InSAR monitoring can significantly improve global bridge risk assessments by reducing uncertainty and helping prioritise maintenance, especially in regions without in-situ sensors.
- This piece titled "How Disaster Recovery is Big Business" emphasising how climate-related disasters are not just an environmental niche, but with actual economic implications.
- This line (summarised for brevity here) stood out to me: "The US economy has grown by $20 trillion since 2000, while the US has spent about $7.7 trillion in disaster-related costs since 2000."
- This report from the World Meteorological Organization showing how carbon dioxide levels in the atmosphere increased in 2024, underscoring that global emissions cuts remain far off track.
🛰️ Scene from Space
One visual leveraging EO
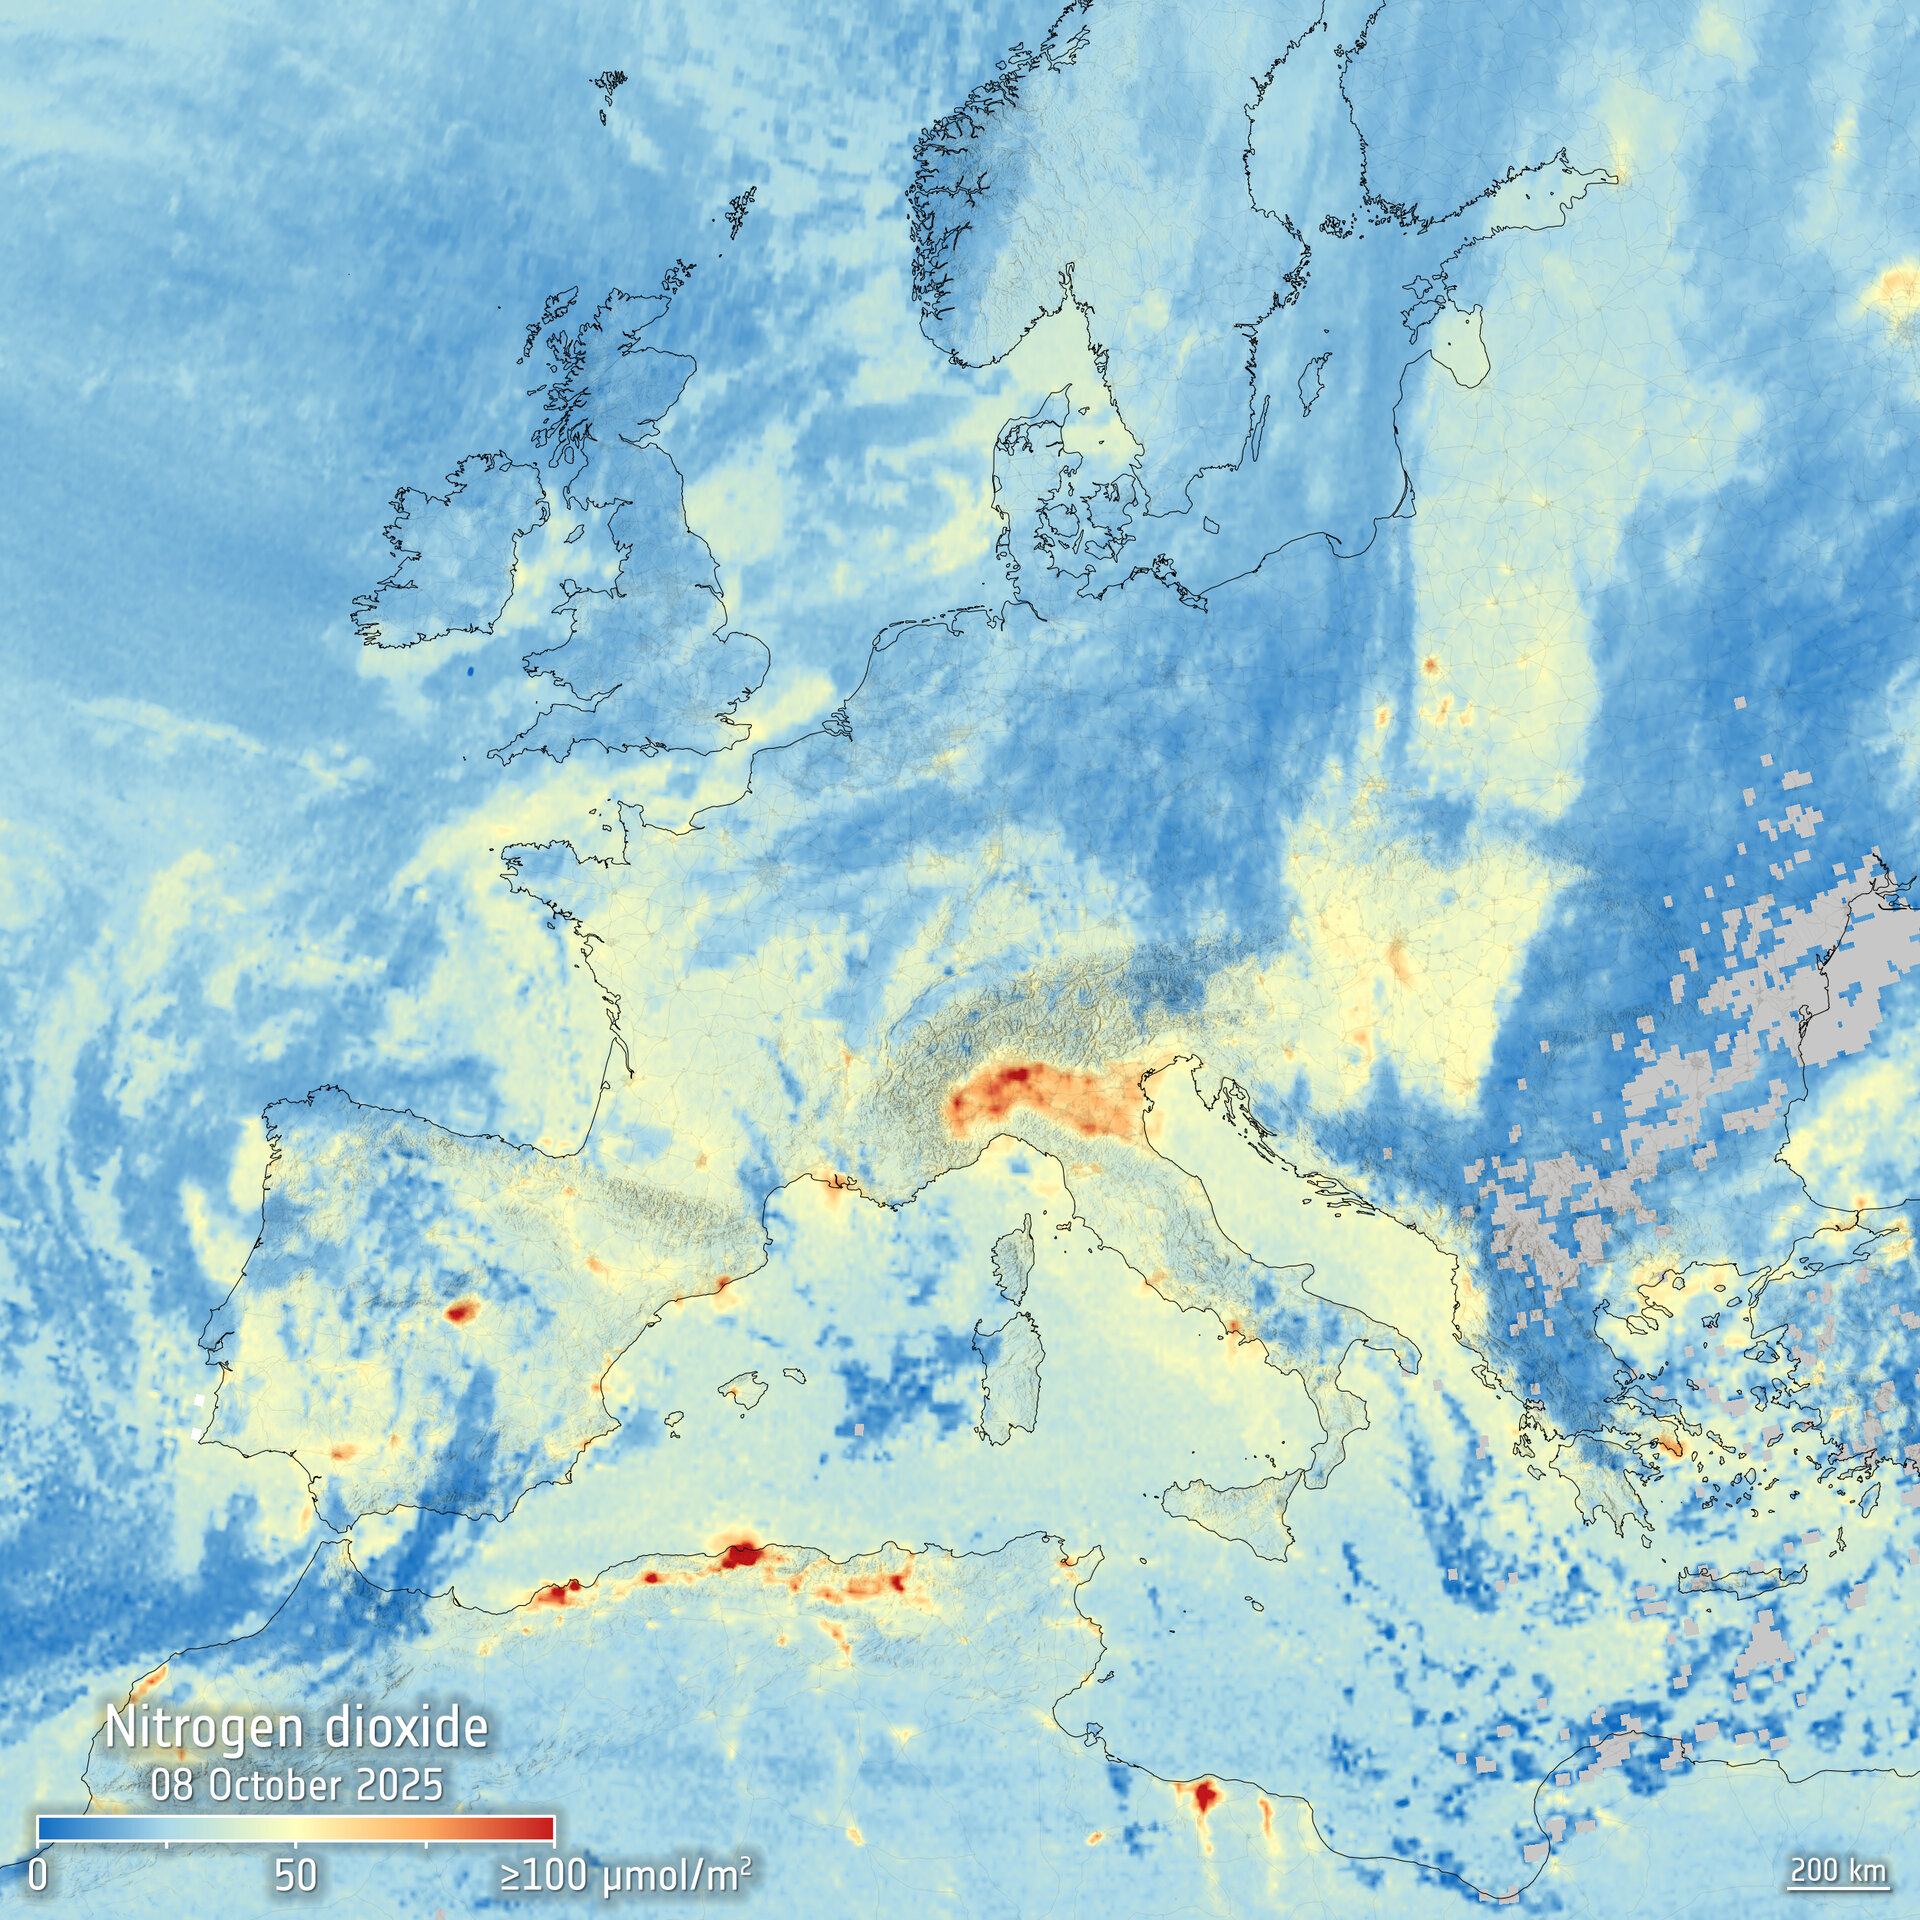
Air Pollution over Europe
The newly launched Copernicus Sentinel-4 mission, onboard the Meteosat Third Generation Sounder (MTG-S) satellite, has delivered its first images, mapping concentrations of nitrogen dioxide, sulphur dioxide, and ozone across Europe.
Operating from geostationary orbit (36,000 kms away), Sentinel-4 continuously scans the same areas every hour and hence provides near-real-time updates on atmospheric pollution.
The image below shows some clear nitrogen dioxide₂ hotspots, though cloud-covered areas remain unmeasured, which is a known limitation of optical atmospheric sensors.
Until next time,
Aravind.


