

Welcome to a new edition of ‘Last Week in Earth Observation’, containing a summary of major developments in EO from the last week and some exclusive analysis and insights from TerraWatch.
Four Curated Things
Major developments in EO from the past week
💰 Contractual Stuff: Funding, Contracts and Deals
Contracts
- Polish EO satellite manufacturer Creotech Instruments signed a contract worth €52M to build and deliver three EO satellites for the country's national constellation CAMILA.
- With this, the number of active sovereign EO constellations i.e. those with allocated budgets and ongoing contracts is now 28.
📈 Strategic Stuff: Partnerships and Announcements
Announcements
- Climate TRACE, a non-profit coalition of organizations that uses satellite data among other sources to report greenhouse gas emissions, began its monthly updates for GHG reports globally, for every major sector and subsector.
Partnerships
- EO satellite manufacturer Sidus Space rolled out its near real-time vessel detection and classification capabilities, through a partnership with edge computing solution provider, Little Place Labs;
- SkyFi announced a partnership with Pixxel to integrate its high-resolution hyperspectral satellite data into the SkyFi platform.
🗞️ Interesting Stuff: More News
- NOAA has reported that they will soon decommission 14 datasets, products, and catalogs related to earthquakes and marine, coastal, and estuary science;
- ISRO reported wheat production estimates in India using satellite data;
- The Spanish government approved a loan of €1B over eight years to satellite operator Hisdesat to develop a pair of PAZ 2 SAR satellites.
🔗 Click-Worthy Stuff: Check These Out
- This article from ESA showing that sea-surface temperatures over the past four decades have been getting warmer at an accelerated pace;
- This interview (of yours truly) for a Japanese publication in which I discuss why I started TerraWatch, the state of EO and the role of the public sector.
EO Summit: Detailed Program
When I set out to organise EO Summit, my goal was simple: build the kind of program that I would be genuinely excited to attend and, I think we’ve done just that.
I can quite confidently say that we have assembled one of the most unique speaker lineups you have likely never seen at any other conference. We will have:
🌍 20 real-world case study presentations from end-users and EO companies
🛰️ 12 multidisciplinary panel discussions covering various applications of satellite data across sectors
Go check the program and reserve your place now!

One Quick Insight
Exclusive analysis from TerraWatch
EO for Climate Adaptation
Weather is a manifestation of climate change and whether we like it or not, we need to invest in solutions that can help us adapt to the changing climate - and guess what, we have some data to show from early warning weather systems that they do work concerning saving lives, but economic losses continue to increase as the global economy continues to grow.
We have a lot of work to do to save lives equally around the world and develop solutions that can help anticipate such events and effectively prepare for them.
EO has a crucial role to play in building such adaptation tools and we have already seen them being used - weather forecasting is the most widely used application of EO. 'EO for Climate Adaptation' is a complex market to comprehend – it might seem like several companies are working on the same thing, at least from their websites, thanks to the usage of buzzwords like intelligence, risk, insights, etc.
I figured there should be a better way to understand this fast-growing, yet important market segment within EO, especially if you are an outsider looking in. So, I came up with four categories of EO Climate Adaptation companies - classified based on Impact and Time frame.
Impact - Preparedness vs Responsiveness: Is EO applied for building tools to prepare for or respond to the impacts of climate change?
Time frame - Short Term vs Long Term: Is EO used to develop solutions that would be used in the next few days/weeks or the next few years/decades?
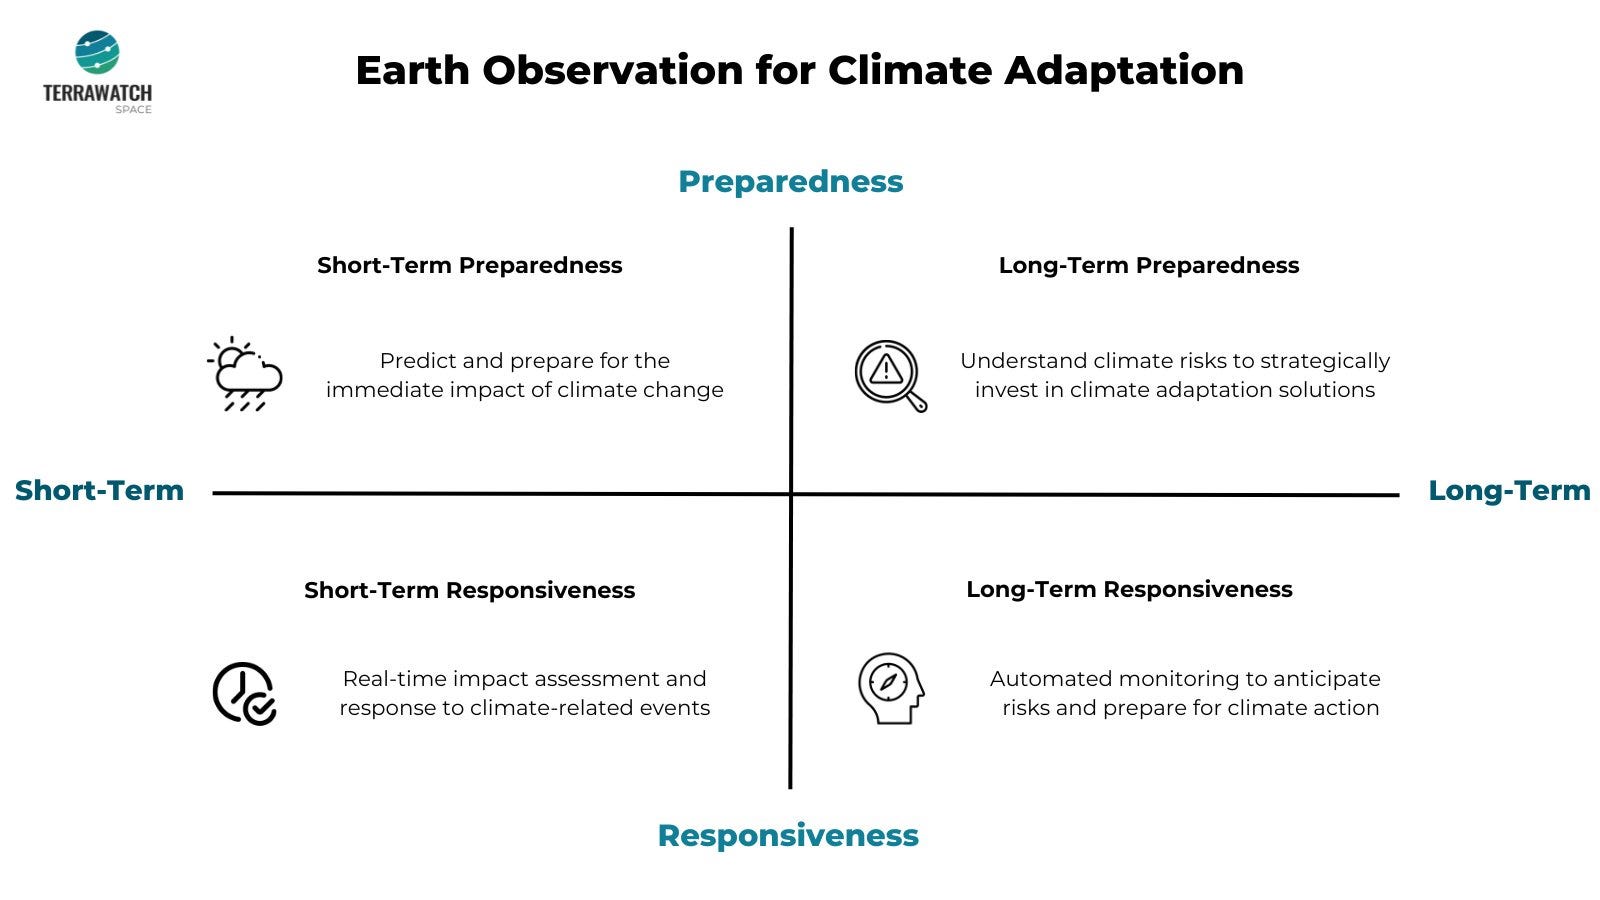
The above framework provided me with four categories of companies, as seen from the four quadrants above:
- Those working on predicting and preparing for the immediate impact of weather impacting several industries at once —> Short-Term Preparedness
- Those working on understanding climate risks for assets, infrastructure and people in the not-too-distant future —> Long-Term Preparedness
- Those providing real-time impact assessment and disaster support to respond to ongoing climate change —> Short-Term Responsiveness
- Those enabling automated monitoring of assets to respond efficiently by anticipating risks —> Long-Term Responsiveness
I will leave it to you to categorise and position companies in the EO for climate commercial landscape on the four quadrants – it is a fun exercise to try on companies you come across that are leveraging EO data to build climate-related solutions. You will be able to quickly see in which category we have too many solutions and in which one, we have too few solutions.
EO Summit: Flash Sale (Extended)
Due to popular demand, we are extending the flash ticket sale for EO Summit by 48 hours – until April 22 midnight ET.
This is your final chance to get upto 50% off (depending on your category), before prices go up!

Scene from Space
One visual leveraging EO
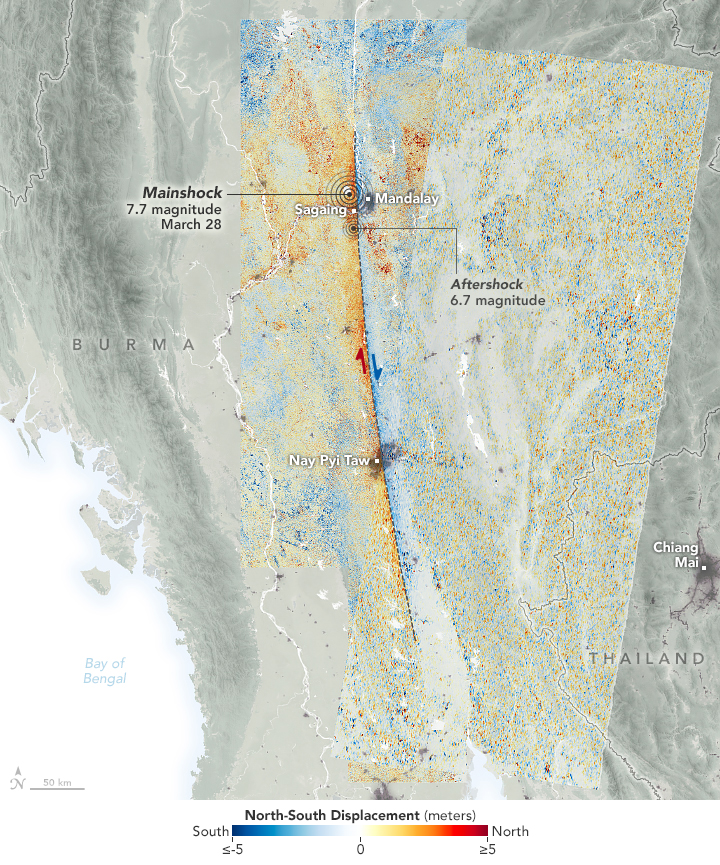
Ground Motion of the Myanmar Earthquake
Researchers at NASA’s Jet Propulsion Laboratory used data from Sentinel-1 (SAR) and Sentinel-2 (optical) satellites to visualize how the land moved during the earthquake in Myanmar, which led to over 3,000 casualties and injured several thousands.
In the image below from NASA, red pixels indicate northward motion, while blue pixels show movement to the south. The data highlights ground displacements of more than 3 meters (10 feet) along portions of the fault, including a total offset of more than 6 meters in some places.
Until next time,
Aravind.


