

Welcome to a new, belated edition of ‘Last Week in Earth Observation’, containing a summary of major developments in EO from the last week and some exclusive analysis and insights from TerraWatch.
Four Curated Things
Major developments in EO from the past week
💰 Contractual Stuff: Funding, Contracts and Deals
Funding
- Privateer, which expanded into EO through the acquisition of Orbital Insight last year, has received investment from a Saudi Arabian venture capital firm and plans to open an office in the Kingdom;
Contracts
- BlackSky has won a contract from Thales Alenia Space to supply EO data, analytics, and a high-resolution optical satellite as part of a sovereign EO constellation for India’s Nibe Ltd;
- Airbus Defence and Space won a contract to build a pair of SAR satellites as part of UK's goals to build up its military space reconnaissance capabilities.
📈 Strategic Stuff: Partnerships and Announcements
Partnerships
- Indonesia’s meteorological agency signed a partnership with Tomorrow.io to develop an AI-based weather forecasting system;
- GHGSat signed a partnership with oil and gas firm Koda Resources for methane monitoring of its infrastructure in Utah;
- Pixxel is partnering with UK-based EO analytics firm Geospatial Insight to build climate solutions.
🗞️ Interesting Stuff: More News
- NOAA is facing potential disruptions to its core weather forecasting services and climate-related projects;
- BlackSky is set to launch its next-generation satellite capable of acquiring high-resolution 35 cm imagery;
- Spire Global is suing maritime intelligence firm Kpler to enforce the completion of its maritime business sale, as its debt grows.
🔗 Click-Worthy Stuff: Check These Out
- This article from ECMWF that discusses some reasons why the fires in Los Angeles in January were so extreme;
- This paper that shows how to leverage ChatGPT's computer vision capabilities to rank satellite images by poverty level;
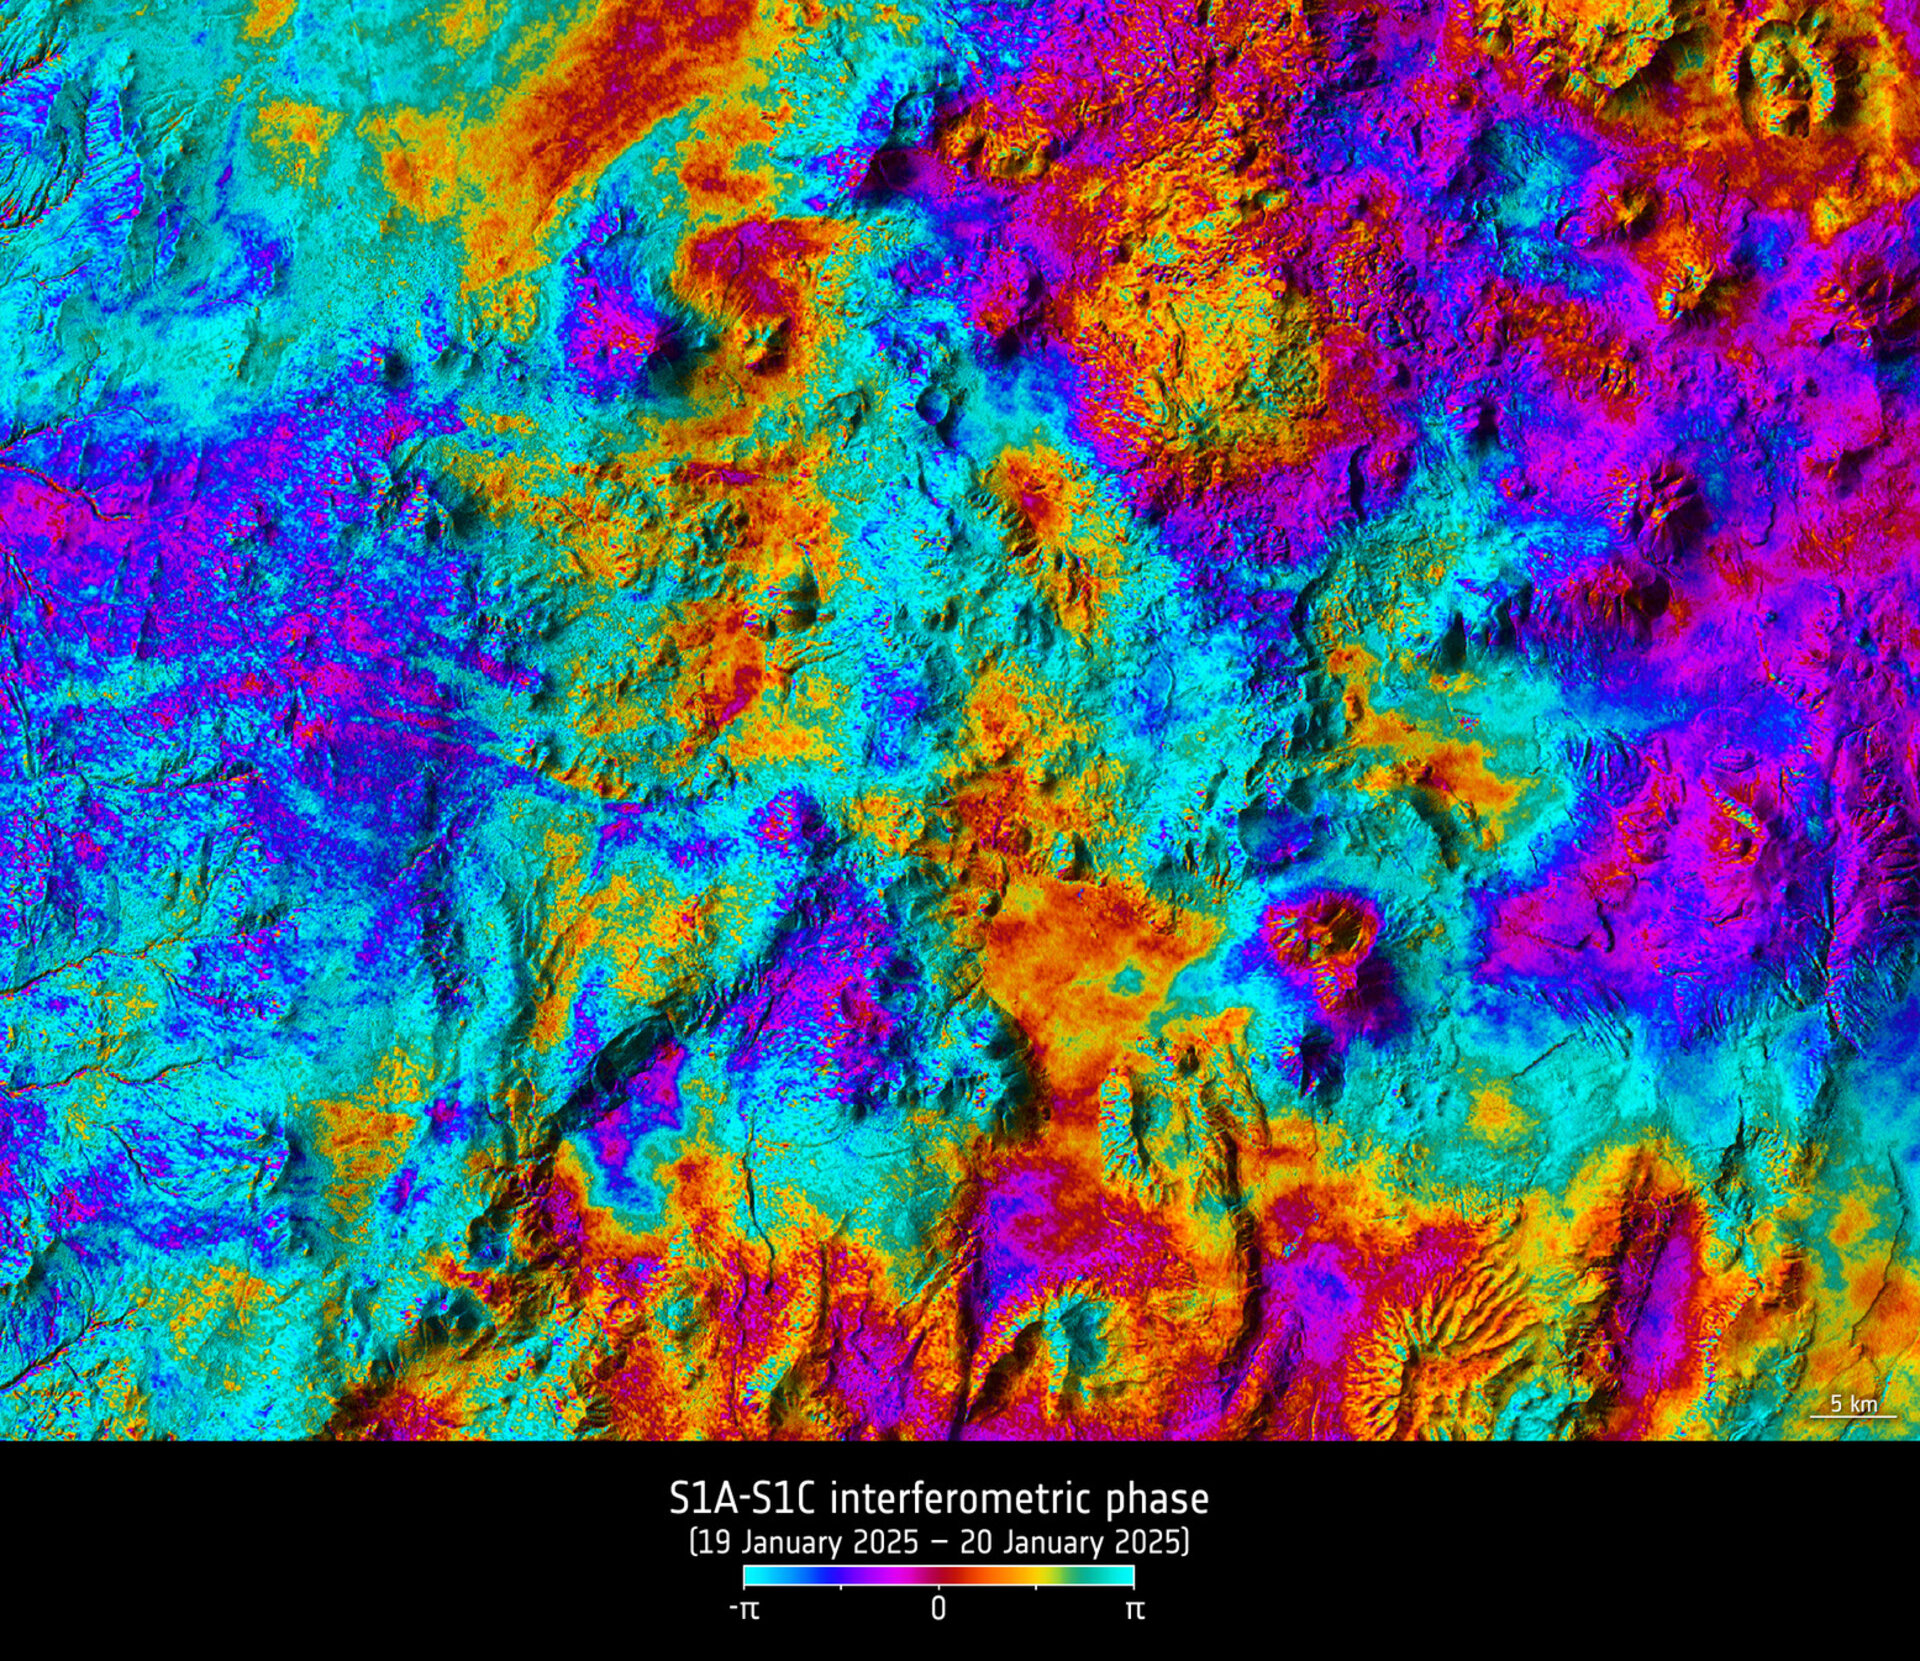
- This article from ESA on how data from the recently launched Sentinel-1C mission is being validated for use through cross-satellite interferometry.
- And, here is a quick primer on the magic that is interferometry.
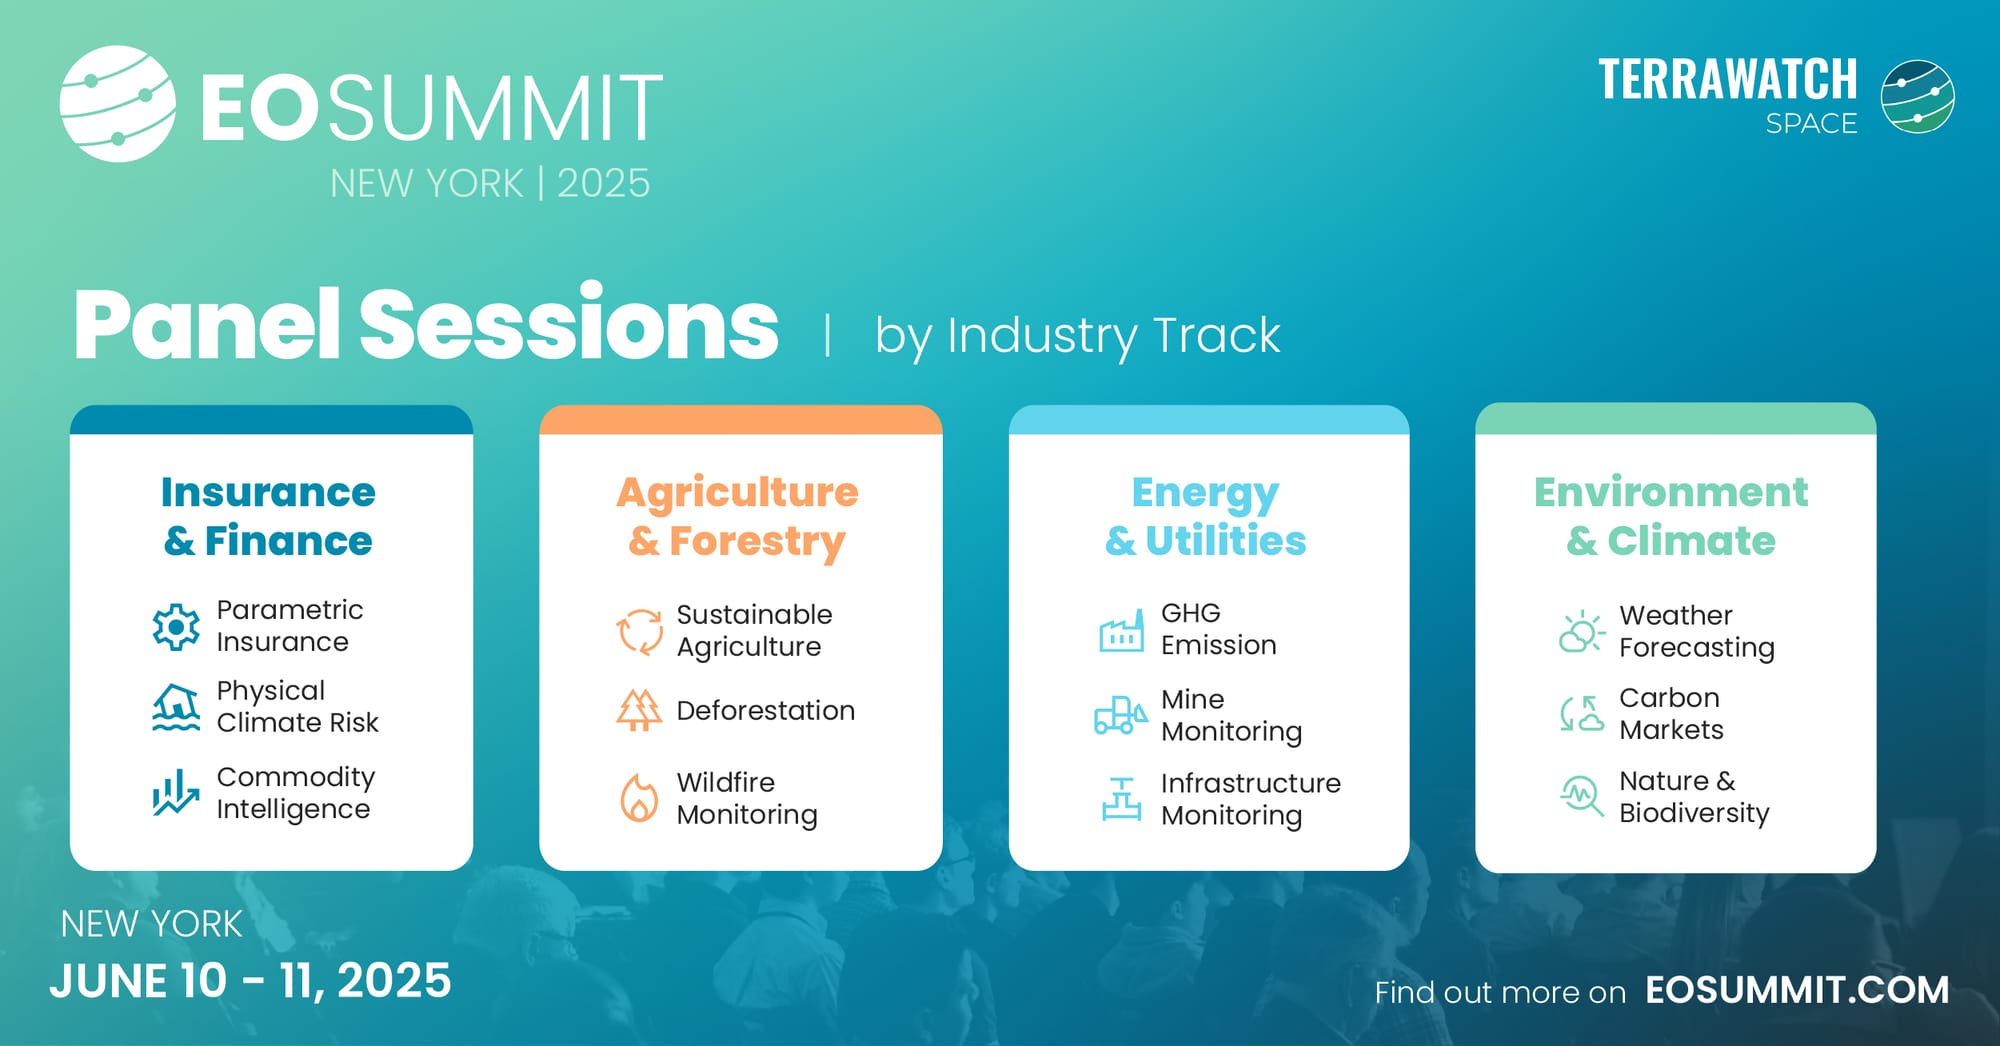
Panel Sessions at EO Summit
The EO Summit this year will have 12 panels on a variety of use cases of satellite data. Unlike most panels in other conferences, all of these panels will be multidisciplinary involving at least four different profiles of participants:
- An EO satellite firm (data provider)
- A EO solution firm (analytics provider)
- An EO end user (enterprise or government)
- A market enabler (non-profits or think tanks)
PS. Early bird sales are still on and we have a few more tickets remaining!
One Discussion Point
Exclusive analysis and insights from TerraWatch
5. Impact of Edge Computing on the EO Value Chain
There has been so much talk about edge computing aka onboard processing in the EO sector. But, what impact can edge computing (or on-board processing) have on the EO industry, and more specifically, how does it affect the EO value chain?
If you have read anything from TerraWatch before, you know that I segment the EO Operating Stack into 5 segments: Data, Platform, Analytics, Insights and Applications. Edge computing might have some interesting dynamics on the Platform layer, but its impact on the Analytics layer is perhaps more fascinating.
As a reminder, the Analytics layer is the part of the EO value chain, where data is converted into useful information, sometimes by integrating other sources of data. However, note that the Analytics layer does not inform, it only translates. You might not be able to make direct decisions with Analytics, as you might need to contextualise the information. Some examples of Analytics are cloud detection, vessel identification, building detection, crop classification etc. As you see, Analytics is all about converting imagery on pixels into some information, but it is not an actionable insight.
And that is what edge computing brings to the table - the ability to process data onboard the satellite, as it is being taken, in order to convert this data into some form of useful information. Note that edge computing might not necessarily provide actionable Insights, nor can it become a usable Application. My thesis is that edge computing helps move the Analytics layer closer to the orbit, but not completely away from the ground, as the figure represents below.

As an example, edge computing may enable the detection of clouds in orbit, but might not succeed in detecting all clouds in the image from the start. It may enable the detection of vessels in the sea, but may not provide a 100 percent accuracy to begin with. And, the power of edge computing may not be enough to detect objects that are inherently harder to detect scalably (like the different types of trees), especially objects that require a lot of training data. The differences between traditional AI (on the ground) vs. edge AI (in orbit) might have limitations on how much information it can derive. At least as long as we successfully build data centers in space, where training data can be stored.
So, what edge computing really does to the EO Operating Stack is it literally shakes things up a bit - moving the Analytics layer closer to orbit. At least for starters, some simple forms of Analytics like cloud detection and vessel detection can be “outsourced” to be performed on-orbit, while the more complex forms of Analytics such as building detection and crop identification might be harder to execute with limited training data available onboard the satellite.
For more on edge computing, check out the exclusive deep dive on the topic, which is accessible to paid subscribers. Not a subscriber? Become one now!
Scene from Space
One visual leveraging EO
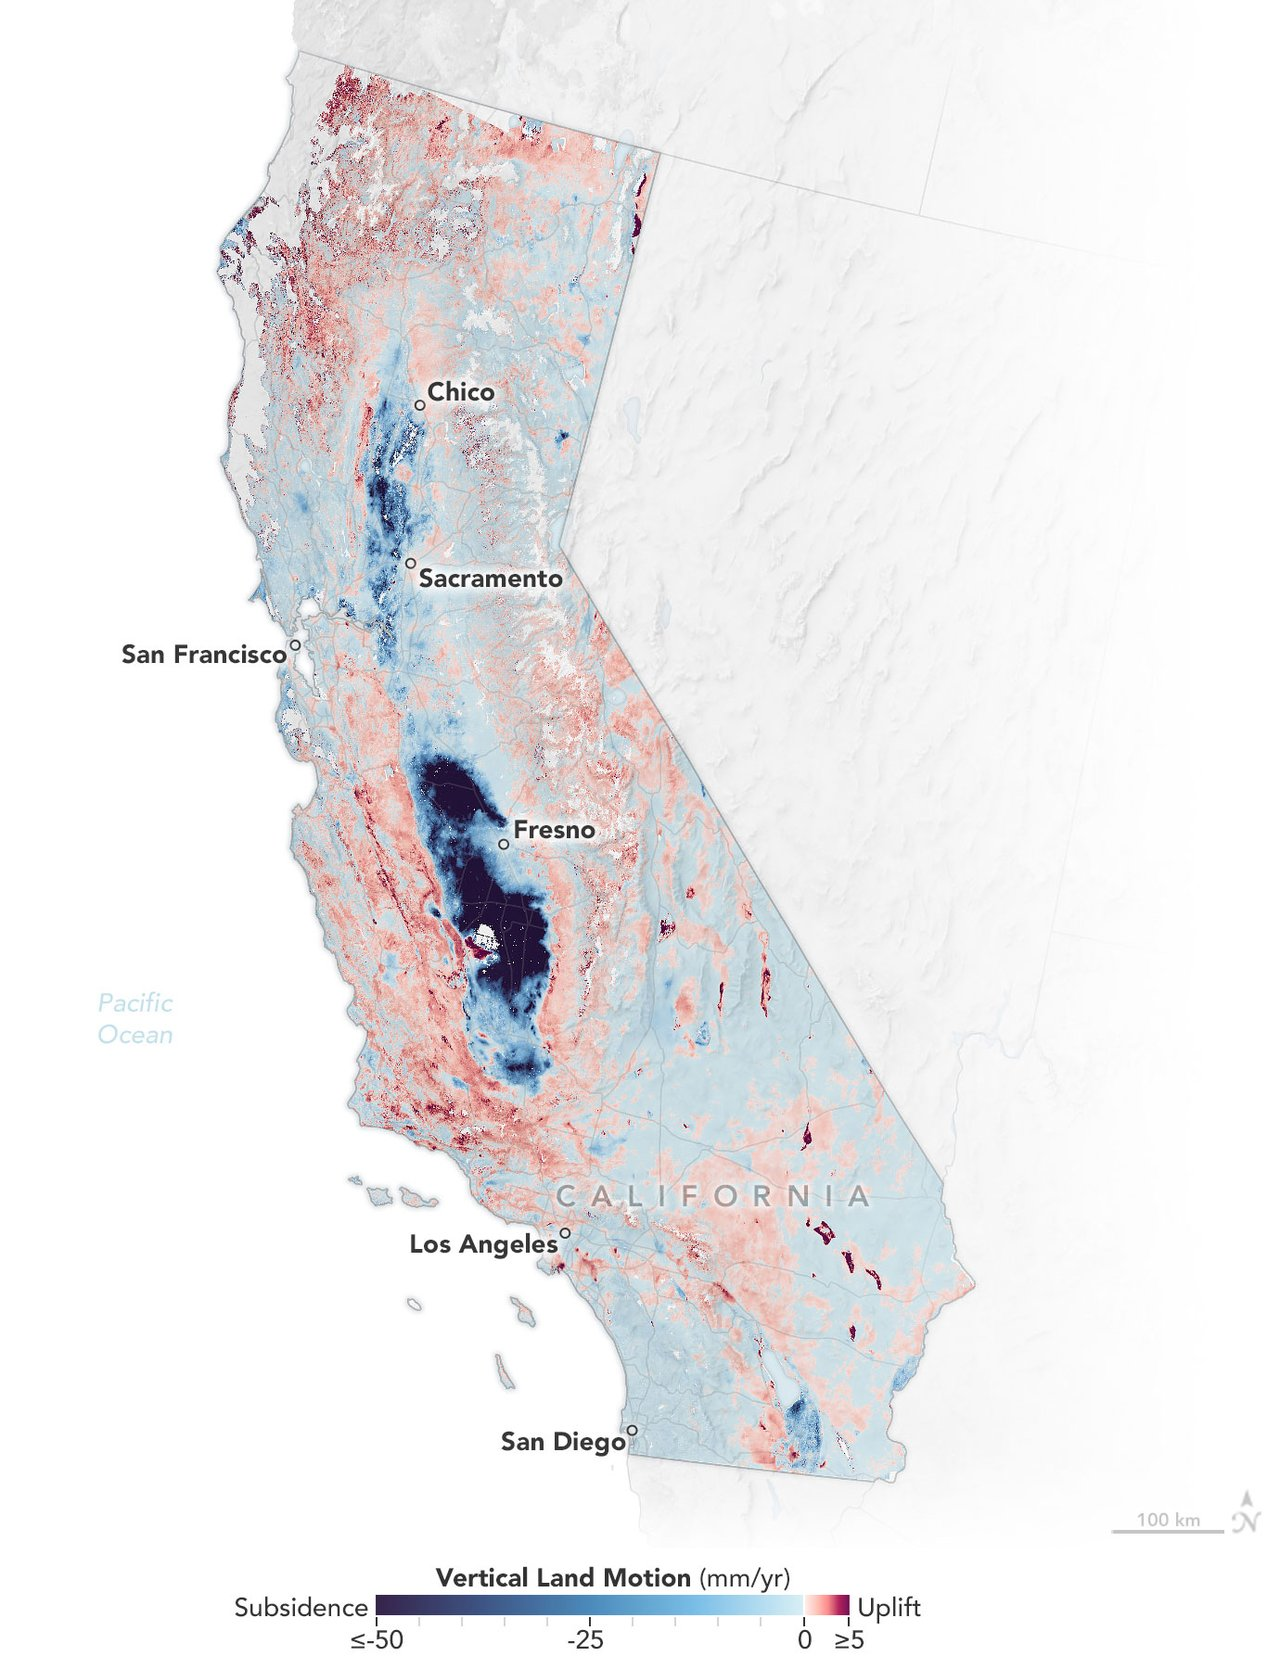
California is Sinking
The following image presents an analysis using SAR data from NASA on how land is sinking (indicated in blue) in coastal California cities and in parts of the Central Valley due to factors like soil compaction, erosion, and groundwater withdrawal. By 2050, sea levels in California are expected to increase between 6 and 14.5 inches (15 and 37 centimeters) higher than year 2000 levels.
Until next time,
Aravind.


