

Welcome to a new edition of ‘Last Week in Earth Observation’, containing a summary of major developments in EO from last week and some analysis on the sector I have come to love.
In this edition: The proliferation of EO platforms, satellite data for post-disaster damage assessment, port disruptions, grassland farming, renewable fuels and more.
Four Curated Things
Major developments in EO from the past week
1. Contractual Stuff: Funding, Contracts and Deals 💰
Thermal imagery startup constellr extended its seed round by €7M, bringing the total funding raised in this round to €17M, which will be used to deploy its first satellites and expand to the US;
PlanetiQ, a US-based weather data provider won a $8M task order from NOAA to deliver radio occultation data from its satellites;
Satellite manufacturing firm, AAC Clyde Space was awarded a £1.25M contract for a 6U satellite from Indian EO startup Kawa Space to collect data for cargo ship route monitoring and illegal fishing;
Edge computing startup, Little Place Labs won a research contract from the US Air Force to evaluate the feasibility of a space-based decentralized Intelligence, Surveillance, and Reconnaissance (ISR) system.
2. Strategic Stuff: Partnerships and Announcements 📈
Maxar announced the release of a new platform called the Maxar Geospatial Platform aimed at simplifying the discovery, purchasing and integration of geospatial data and analytics;
Insurance firm AXA collaborated with French EO company Kayrros to develop a wildfire risk monitoring service in France;
EarthDaily Analytics is partnering with renewable energy group Global Clean Energy Holdings to support the crop growth and adoption of camelina in the renewable fuels marketplace;
Aspia Space, a UK-based startup joined forces with Irish farming firm Origin Digital to develop a tool for measuring grass height using SAR data.
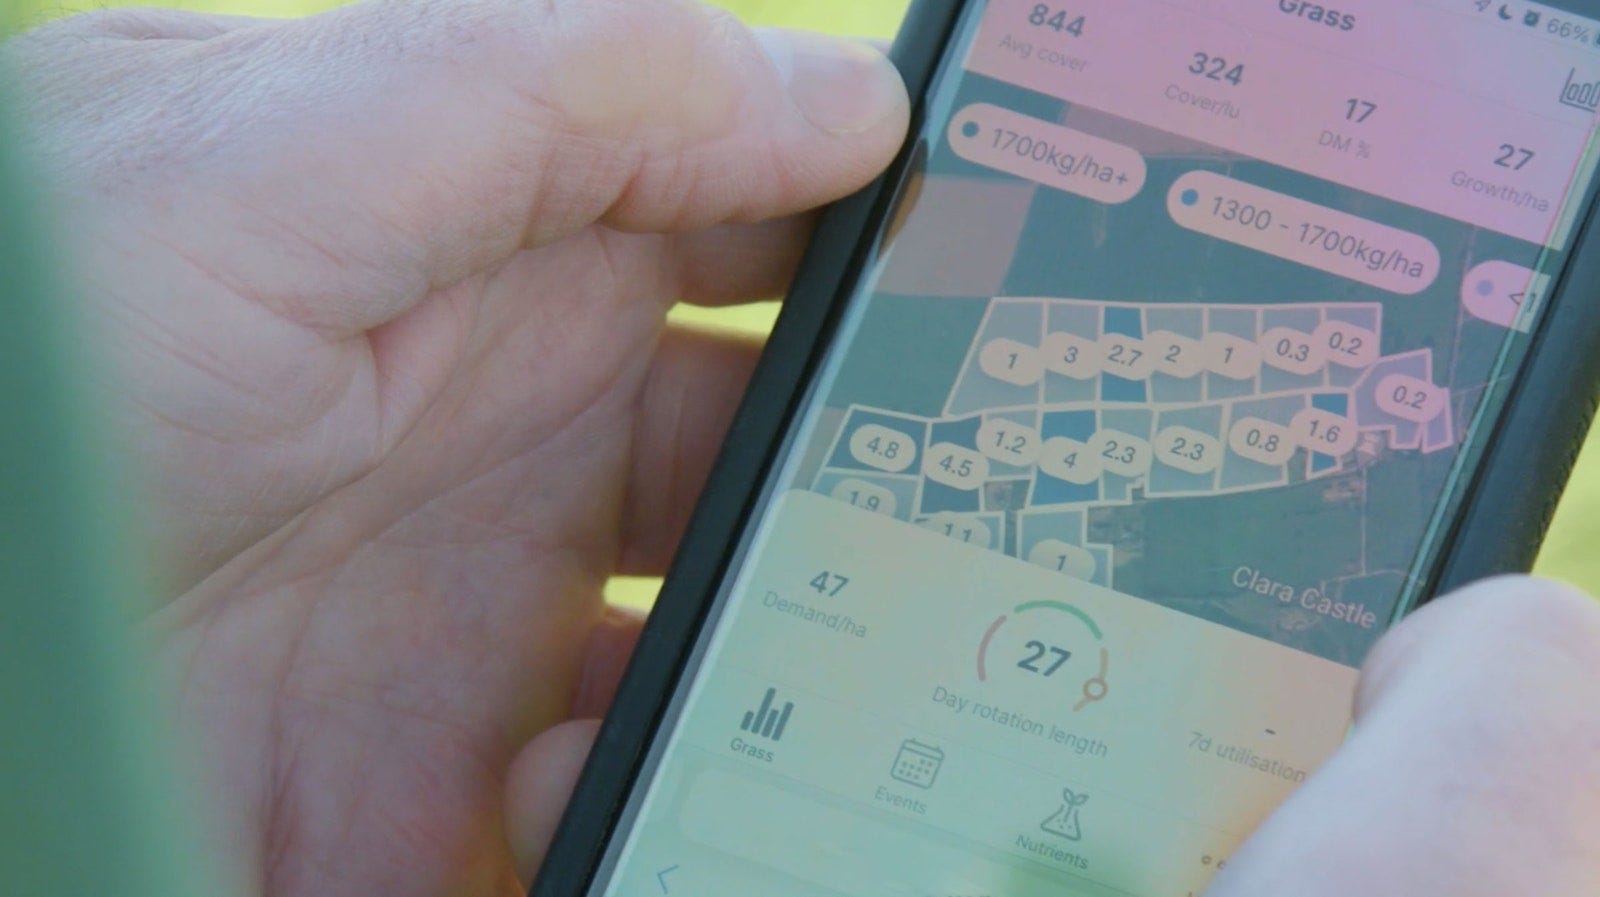
Credit: Origin Digital/Wired
3. Interesting Stuff: More News 🗞️
- Kenya Space Agency and climate adaptation non-profit TomorrowNow.org, have announced a partnership to use space-derived data to transform decision-making in agriculture;
- Two countries in Africa have unveiled their plans to launch EO satellites: Tanzania is expected to launch a satellite later this year focused on environmental monitoring, while Côte d’Ivoire plans to launch an locally-built nanosatellite in the next two years.
4. Click-Worthy Stuff: Check These Out 🔗
- This piece that provides a holistic summary of the role of satellites, drones and IoT for forest monitoring;
- My rant that led to some very interesting discussions on social media regarding the long-term commercial potential of EO;
- This course from the FAO (Food and Agriculture Organization of the United Nations) on using EO data for forest and land monitoring for climate action;
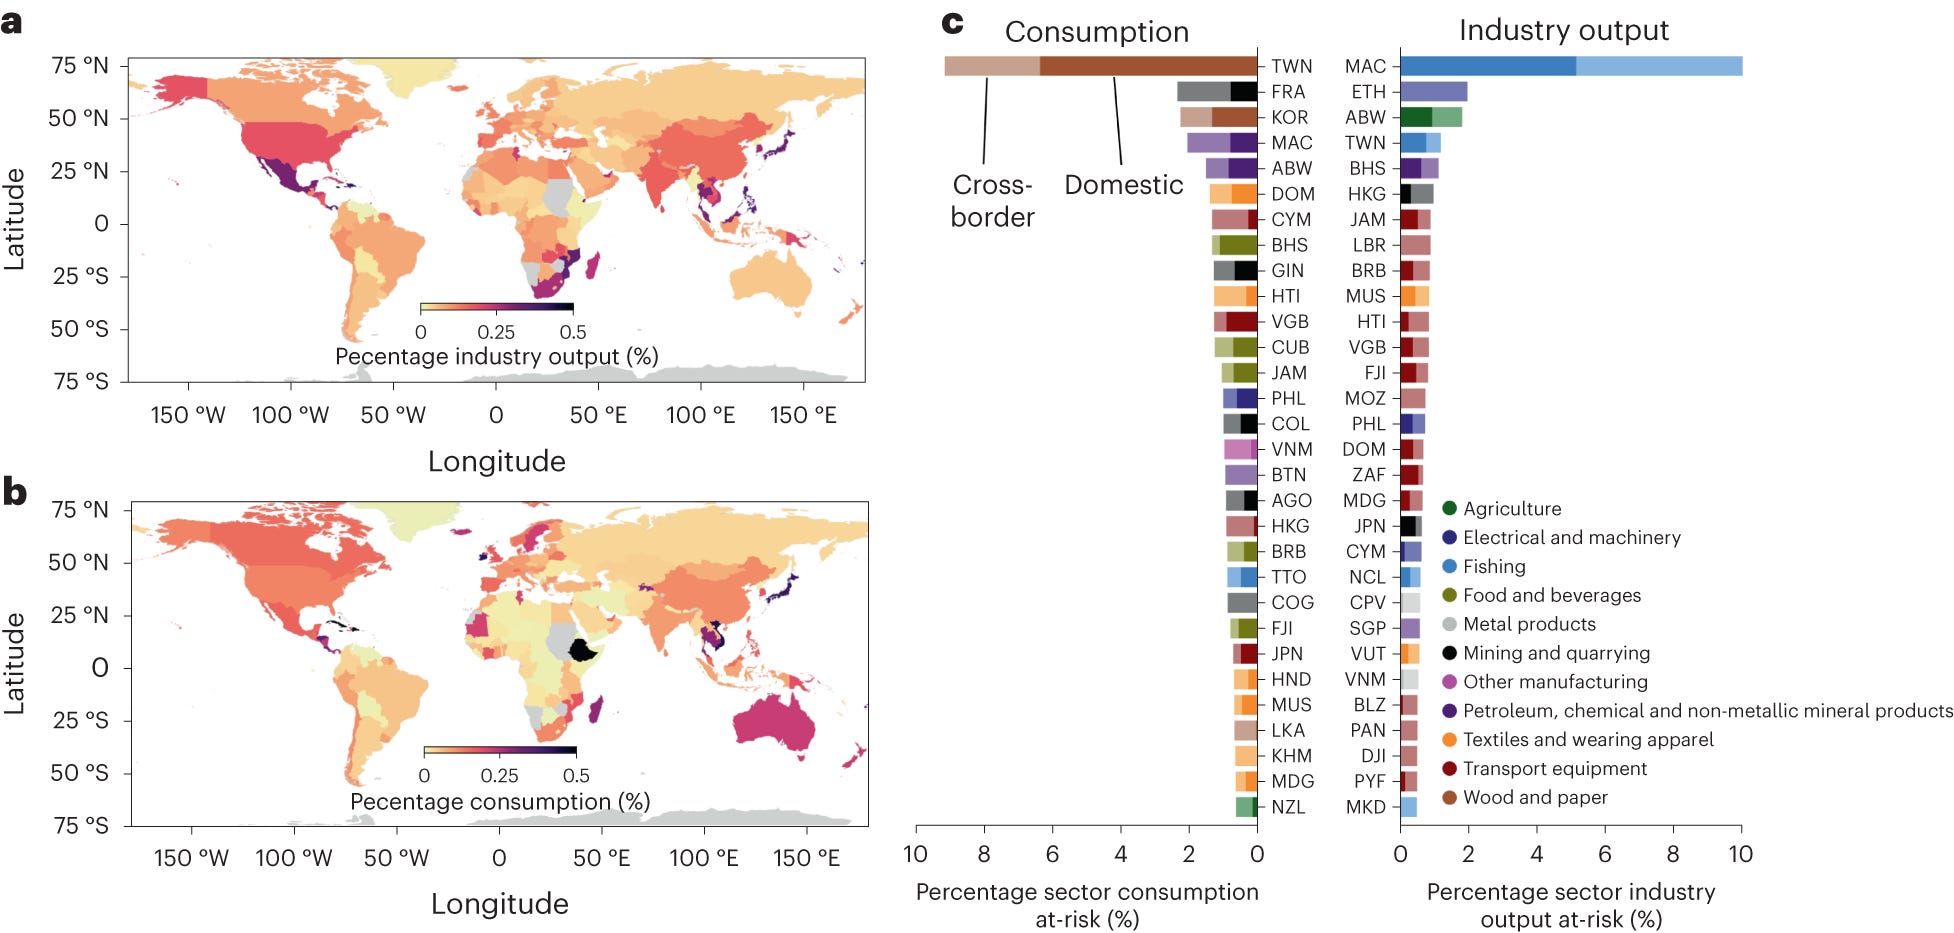
- This paper that uses satellite data to derive the risks from climate-related disruptions at ports and the top 30 most at-risk supply chains per country.
Subscribe to receive Earth observation insights!
One Discussion Point
Analysis, thoughts, and insights on developments in EO
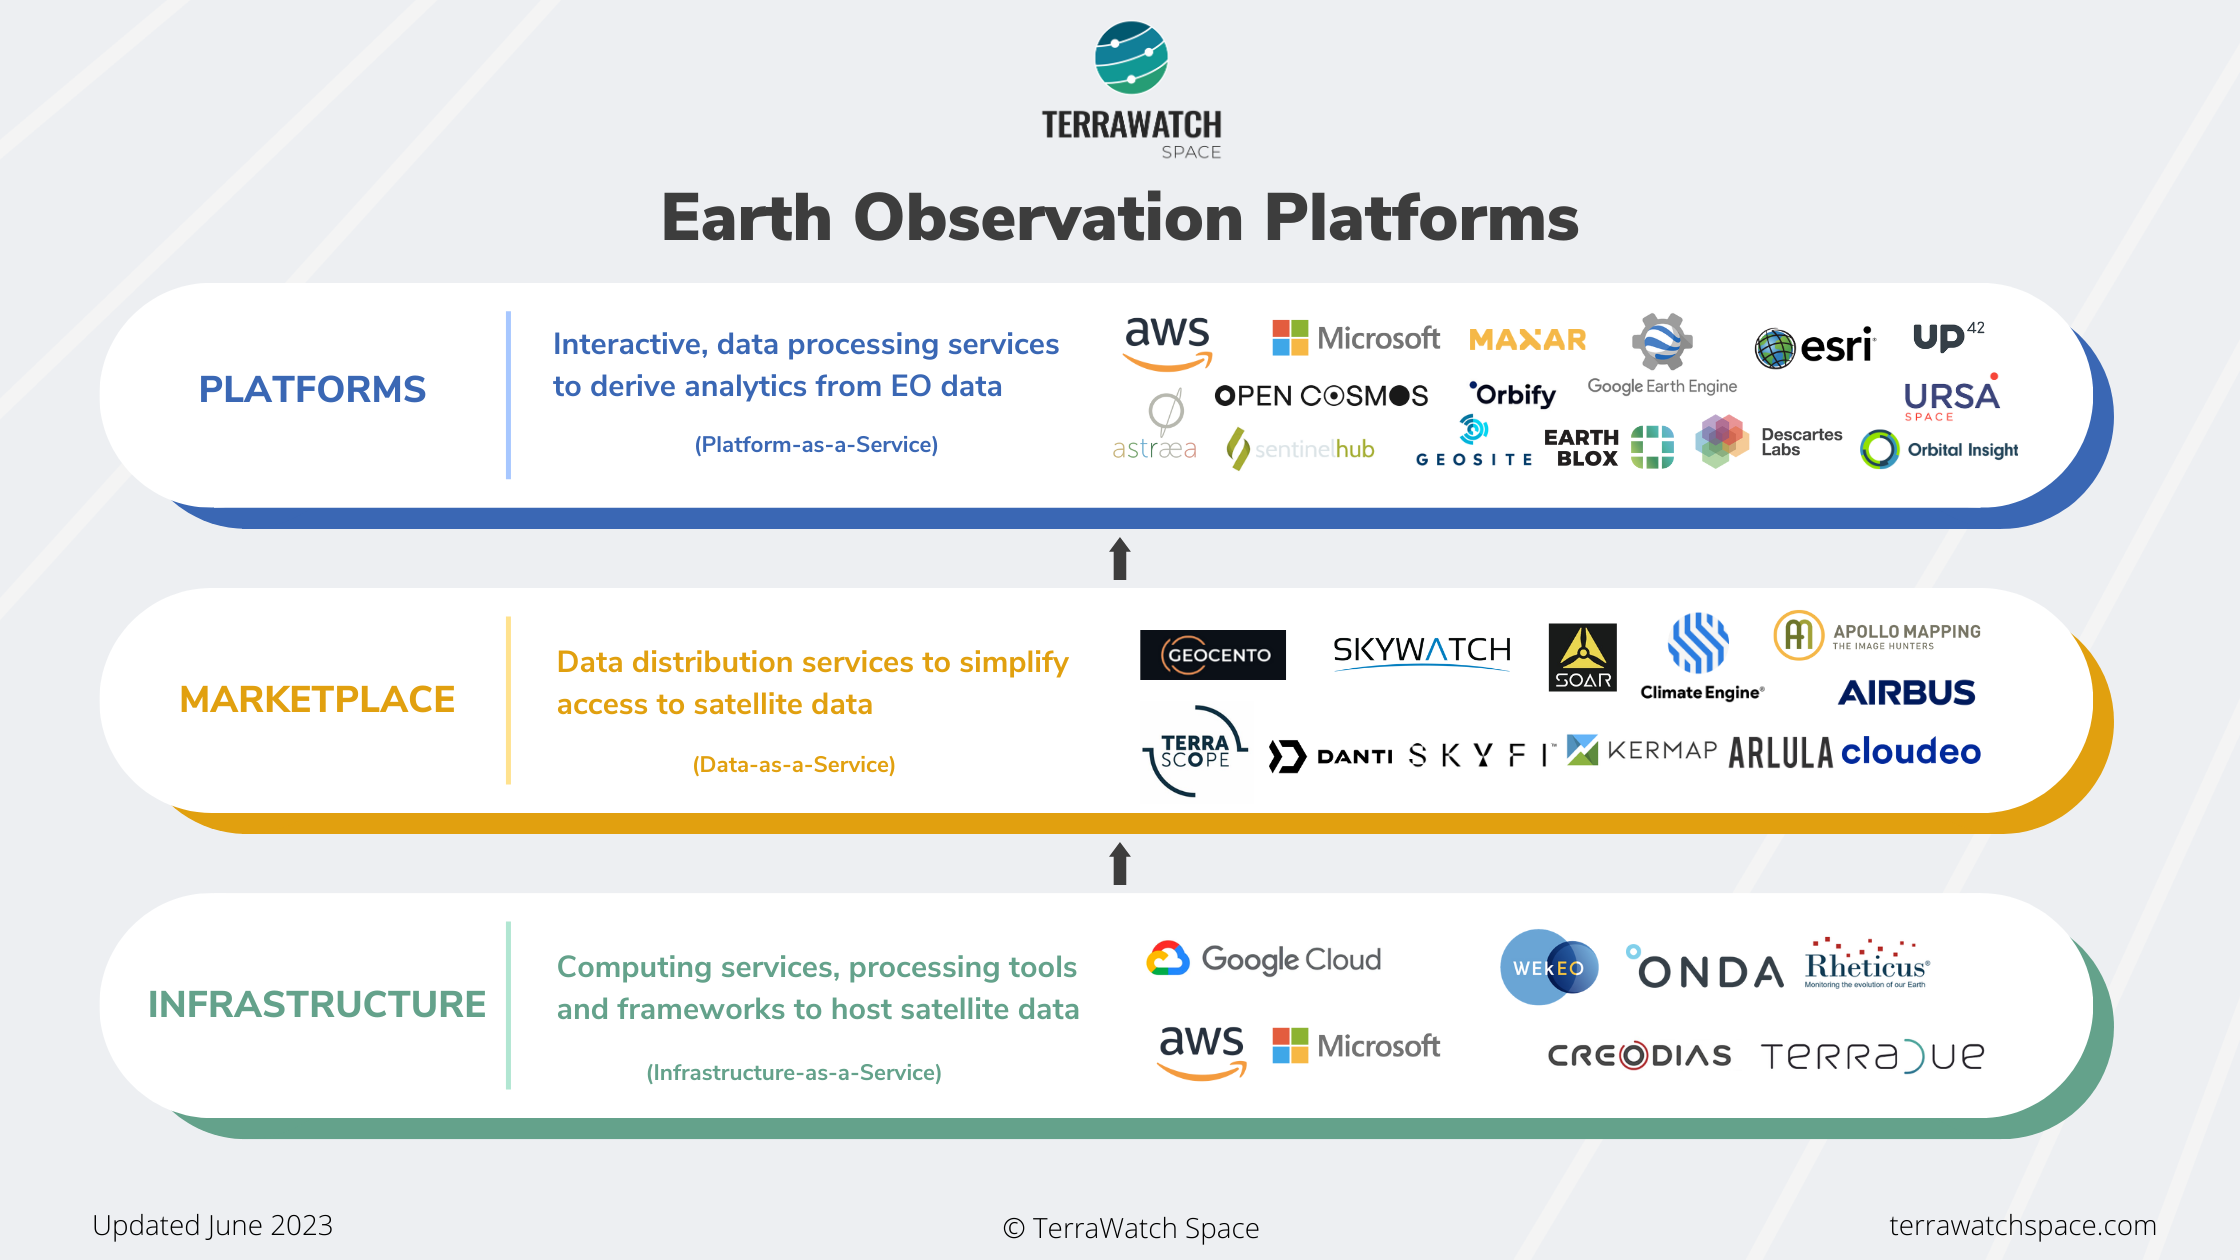
5. The Proliferation of EO Platforms
The past year has seen rapid growth in the number of EO platforms across the three sub-segments: Infrastructure, Marketplace and Platforms. Whether it is marketplaces that provide transparent pricing and allow the purchase of satellite imagery in a few clicks (SkyFi), AI-driven search engines that provide contextual results (Danti), low-code tools that reduce the time for analysis of EO data (EarthBlox/Orbify) or a classic EO platform like the one unveiled by Maxar (an attempt at bringing all their satellite imagery offerings together) - we have seen a lot of activity in the “Platform” layer of EO.
I plan to write a longer blog post on the future of EO platforms, exclusively for the paying subscribers, later in the year, but in essence, EO platforms try and solve some of the most important, yet underrated problems in the sector:
- accessibility (+ affordability): where/how to access the data?
- fusability (+ interoperability): how to work with the different types of data?
- usability (+ suitability). what is this data used for and how can it be used?
The following figure1 shows a breakdown of the EO platform commercial landscape, a revamped version of this will be available in this year’s ‘State of Commercial EO’ report, to be published in the first week of September (check out last year’s version, in case you have not).
Scene from Space
One visual leveraging EO
6. EO for post-disaster damage assessment
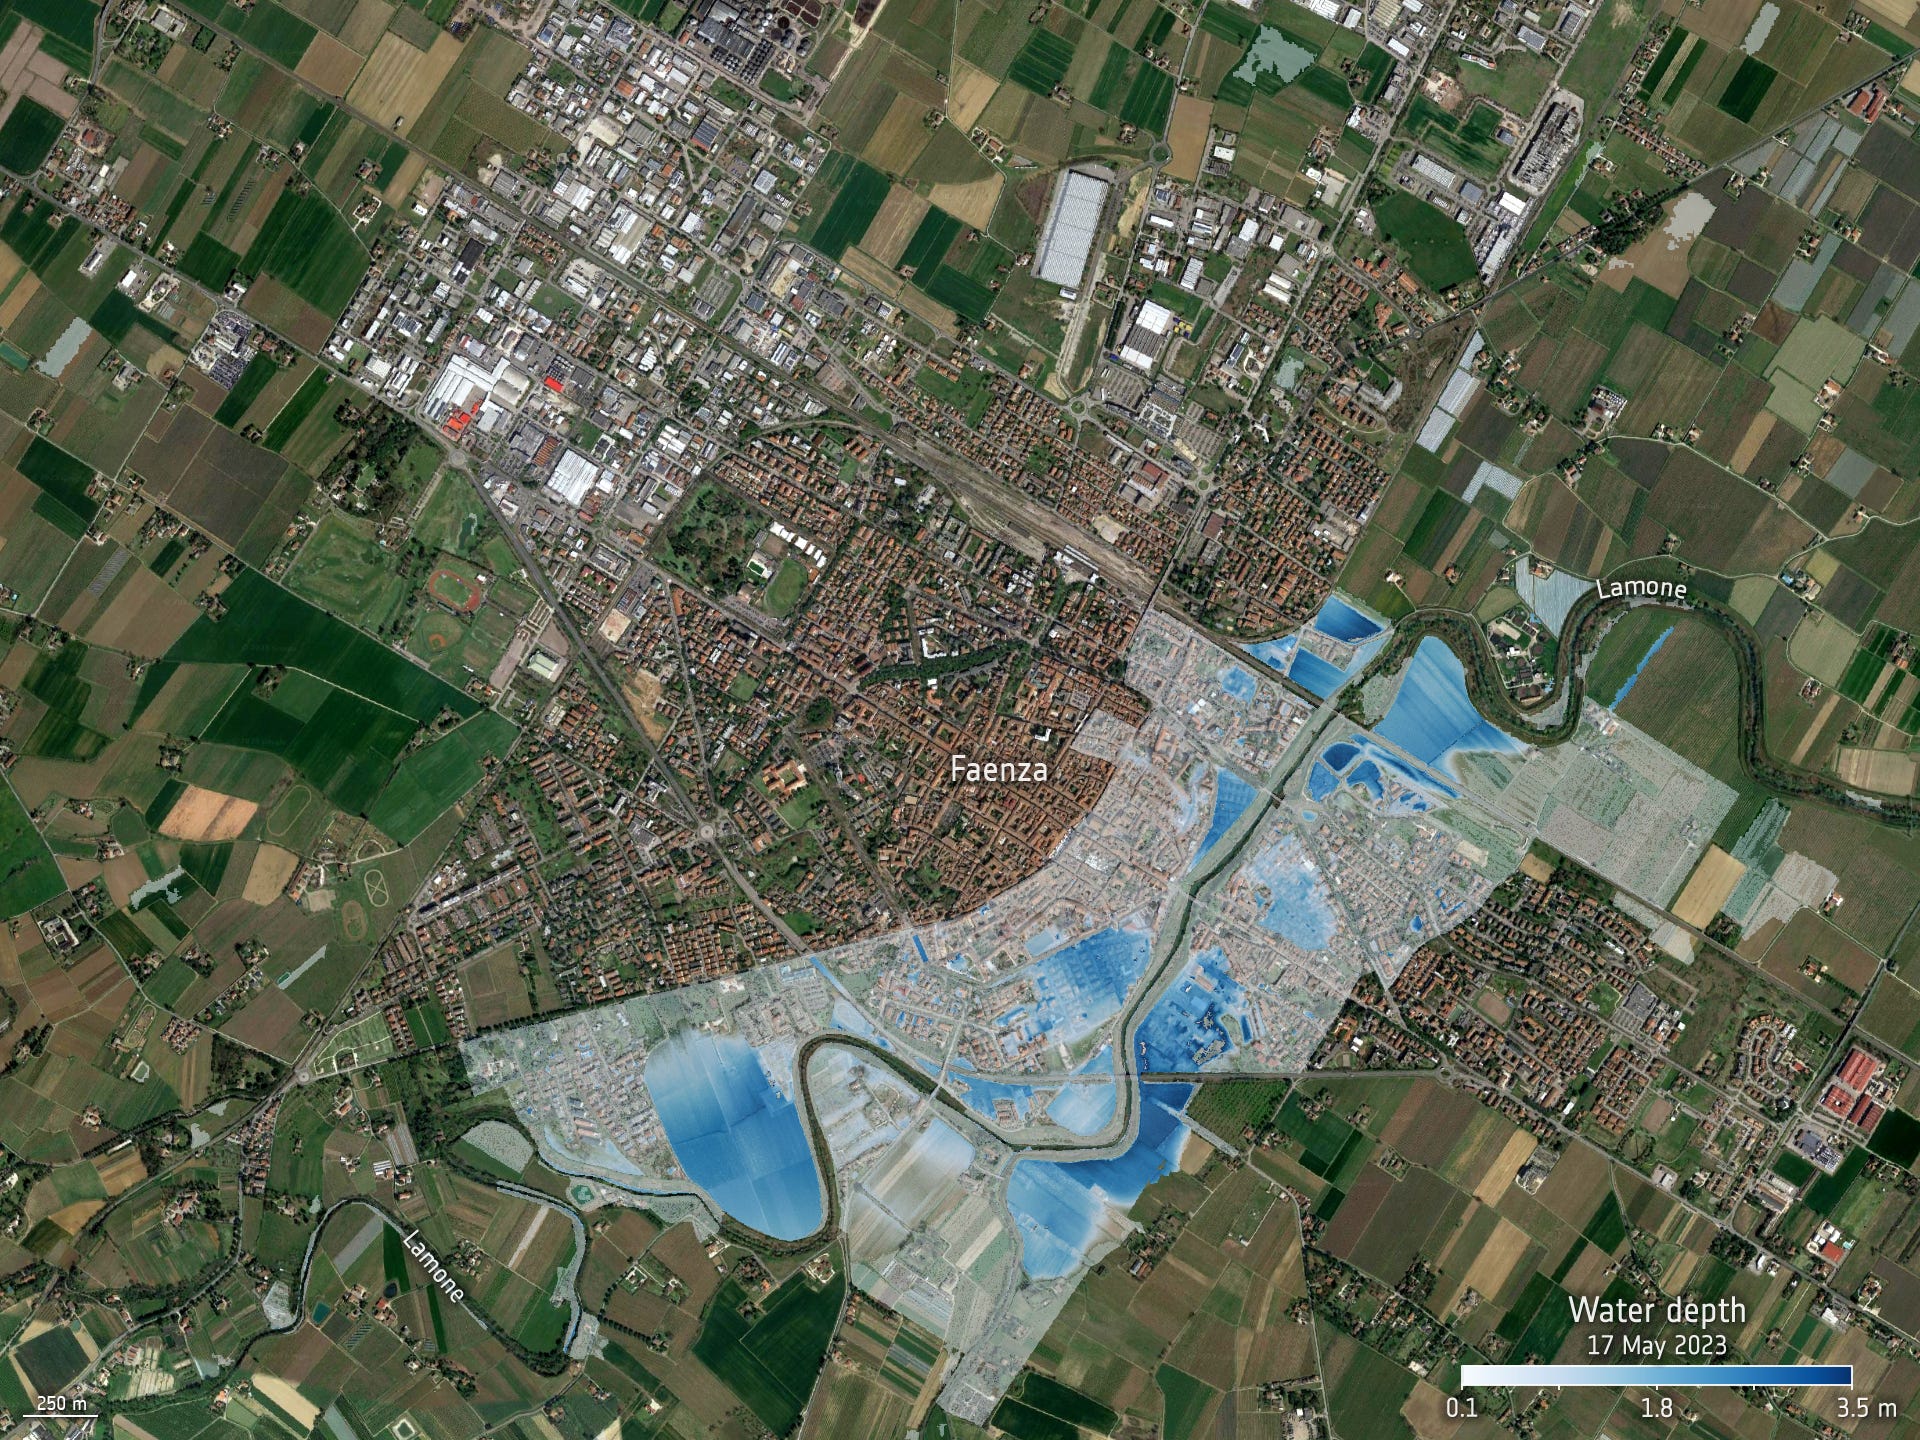
The following image shows the estimated economic losses in euros for residential buildings in the city of Faenza, in the Italian region Emilia-Romagna, which was affected by severe floods in May 2023. The analysis was conducted through the SaferPlaces platform developed by the Italian environmental consulting firm GECOSistema, using flood and water depth maps derived from satellites and in-situ data along with information provided by the local municipalities.
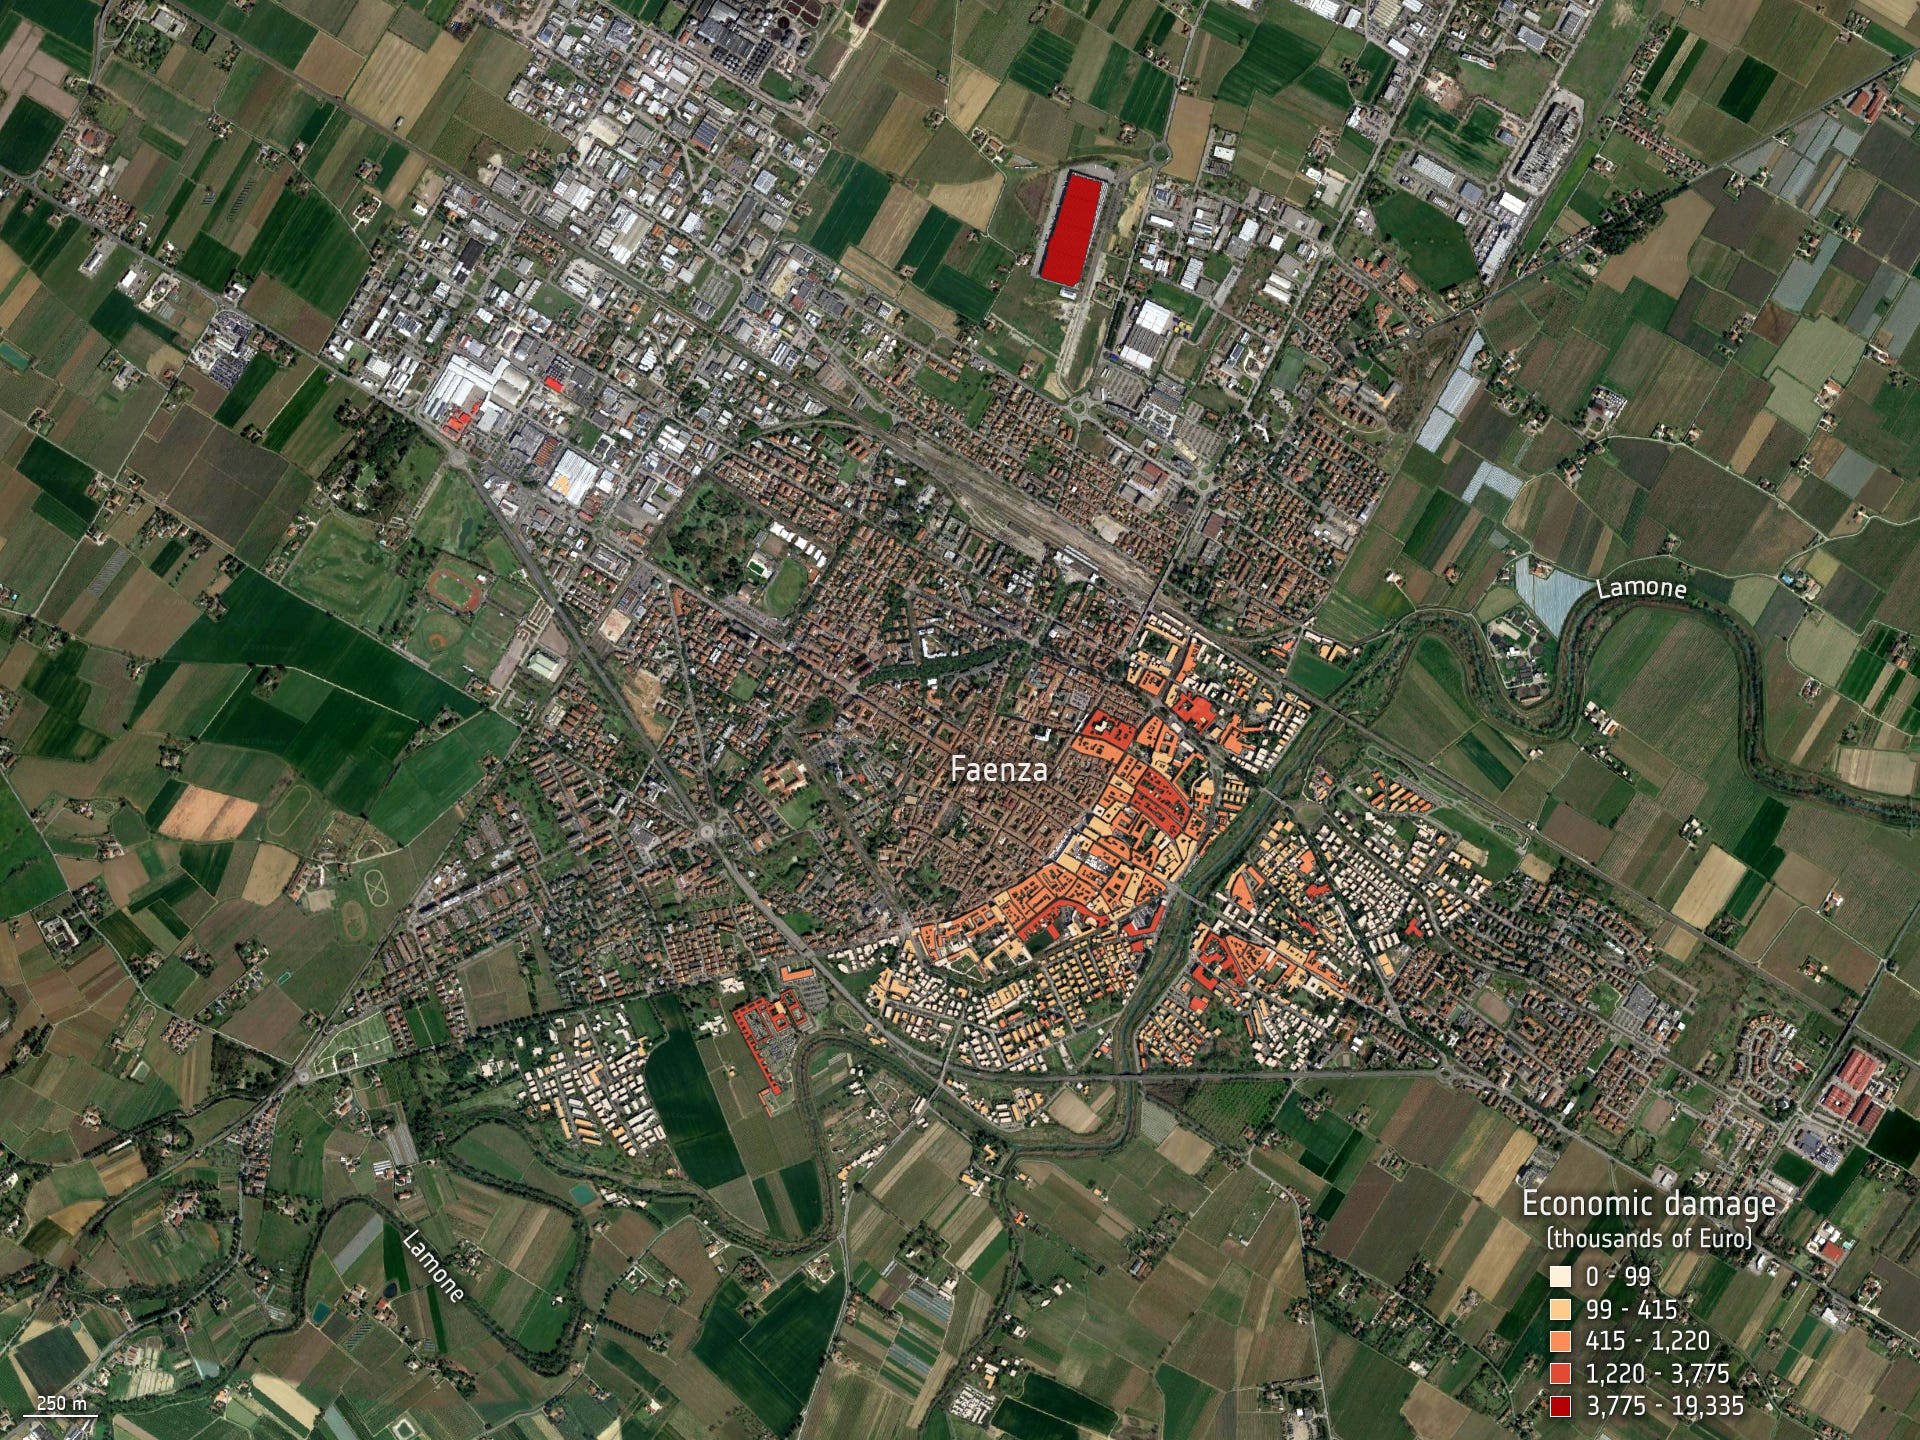
Between 16-18 May, about 350 million cubic metres of water, equivalent to six months’ worth of rain, fell within 36 hours across the region leading to river overflows, landslides and flooding. The following figure shows the distribution of water depth, following the event, in the residential areas of the city.
Until next time,
Aravind.
There are several other organisations whose work is crucial within the EO platform layer, but to keep the infographic as less convoluted as possible, I only focus on the privately-funded, product-driven companies. ↩


