

Welcome to a new, belated edition of ‘Last Week in Earth Observation’, containing a summary of major developments in EO from the last week and some exclusive analysis and insights from TerraWatch.
Note: I will be taking a break next week. So, the next edition will be on June 24.
Four Curated Things
Major developments in EO from the past week
1. Contractual Stuff: Funding, Contracts and Deals 💰
Funding
- South Korean EO startup Nara Space has raised $14.5M in a Series B round to accelerate the development of its upcoming methane-monitoring satellite;
- Spanish climate risk analytics startup Mitiga, which helps companies analyse, report and act on their exposure to climate risk, has raised €8M;
Contracts
- EO startup Array Labs won a $1.25M contract from the US Air Force to develop high-bandwidth systems, to improve data transmission rates.
2. Strategic Stuff: Partnerships and Announcements 📈
Announcements
- Planet announced that the company’s first hyperspectral satellite Tanager-1 is ready for launch in the next SpaceX Transporter mission in July;
Partnerships
- EO satellite firm Axelspace is partnering with EO platform company Arlula, through which Axelspace’s data will be accessible to users;
- Danish satellite company Space Inventor is teaming up with satellite communications firm Addvalue for a mission that aims to demonstrate real-time maritime surveillance;
- Planet and satellite communications firm SES completed a successful data relay demonstration mission for NASA.
3. Interesting Stuff: More News 🗞️
- Australian researchers have pioneered a new technique that can detect bushfires from space “500 times faster” than traditional monitoring;
- The French government has barred Preligens, an EO-based geospatial intelligence firm, from being sold to a foreign investment fund;
- ISRO, in collaboration with its French counterpart CNES, will launch a dedicated satellite to monitor Earth's surface temperatures, called TRISHNA;
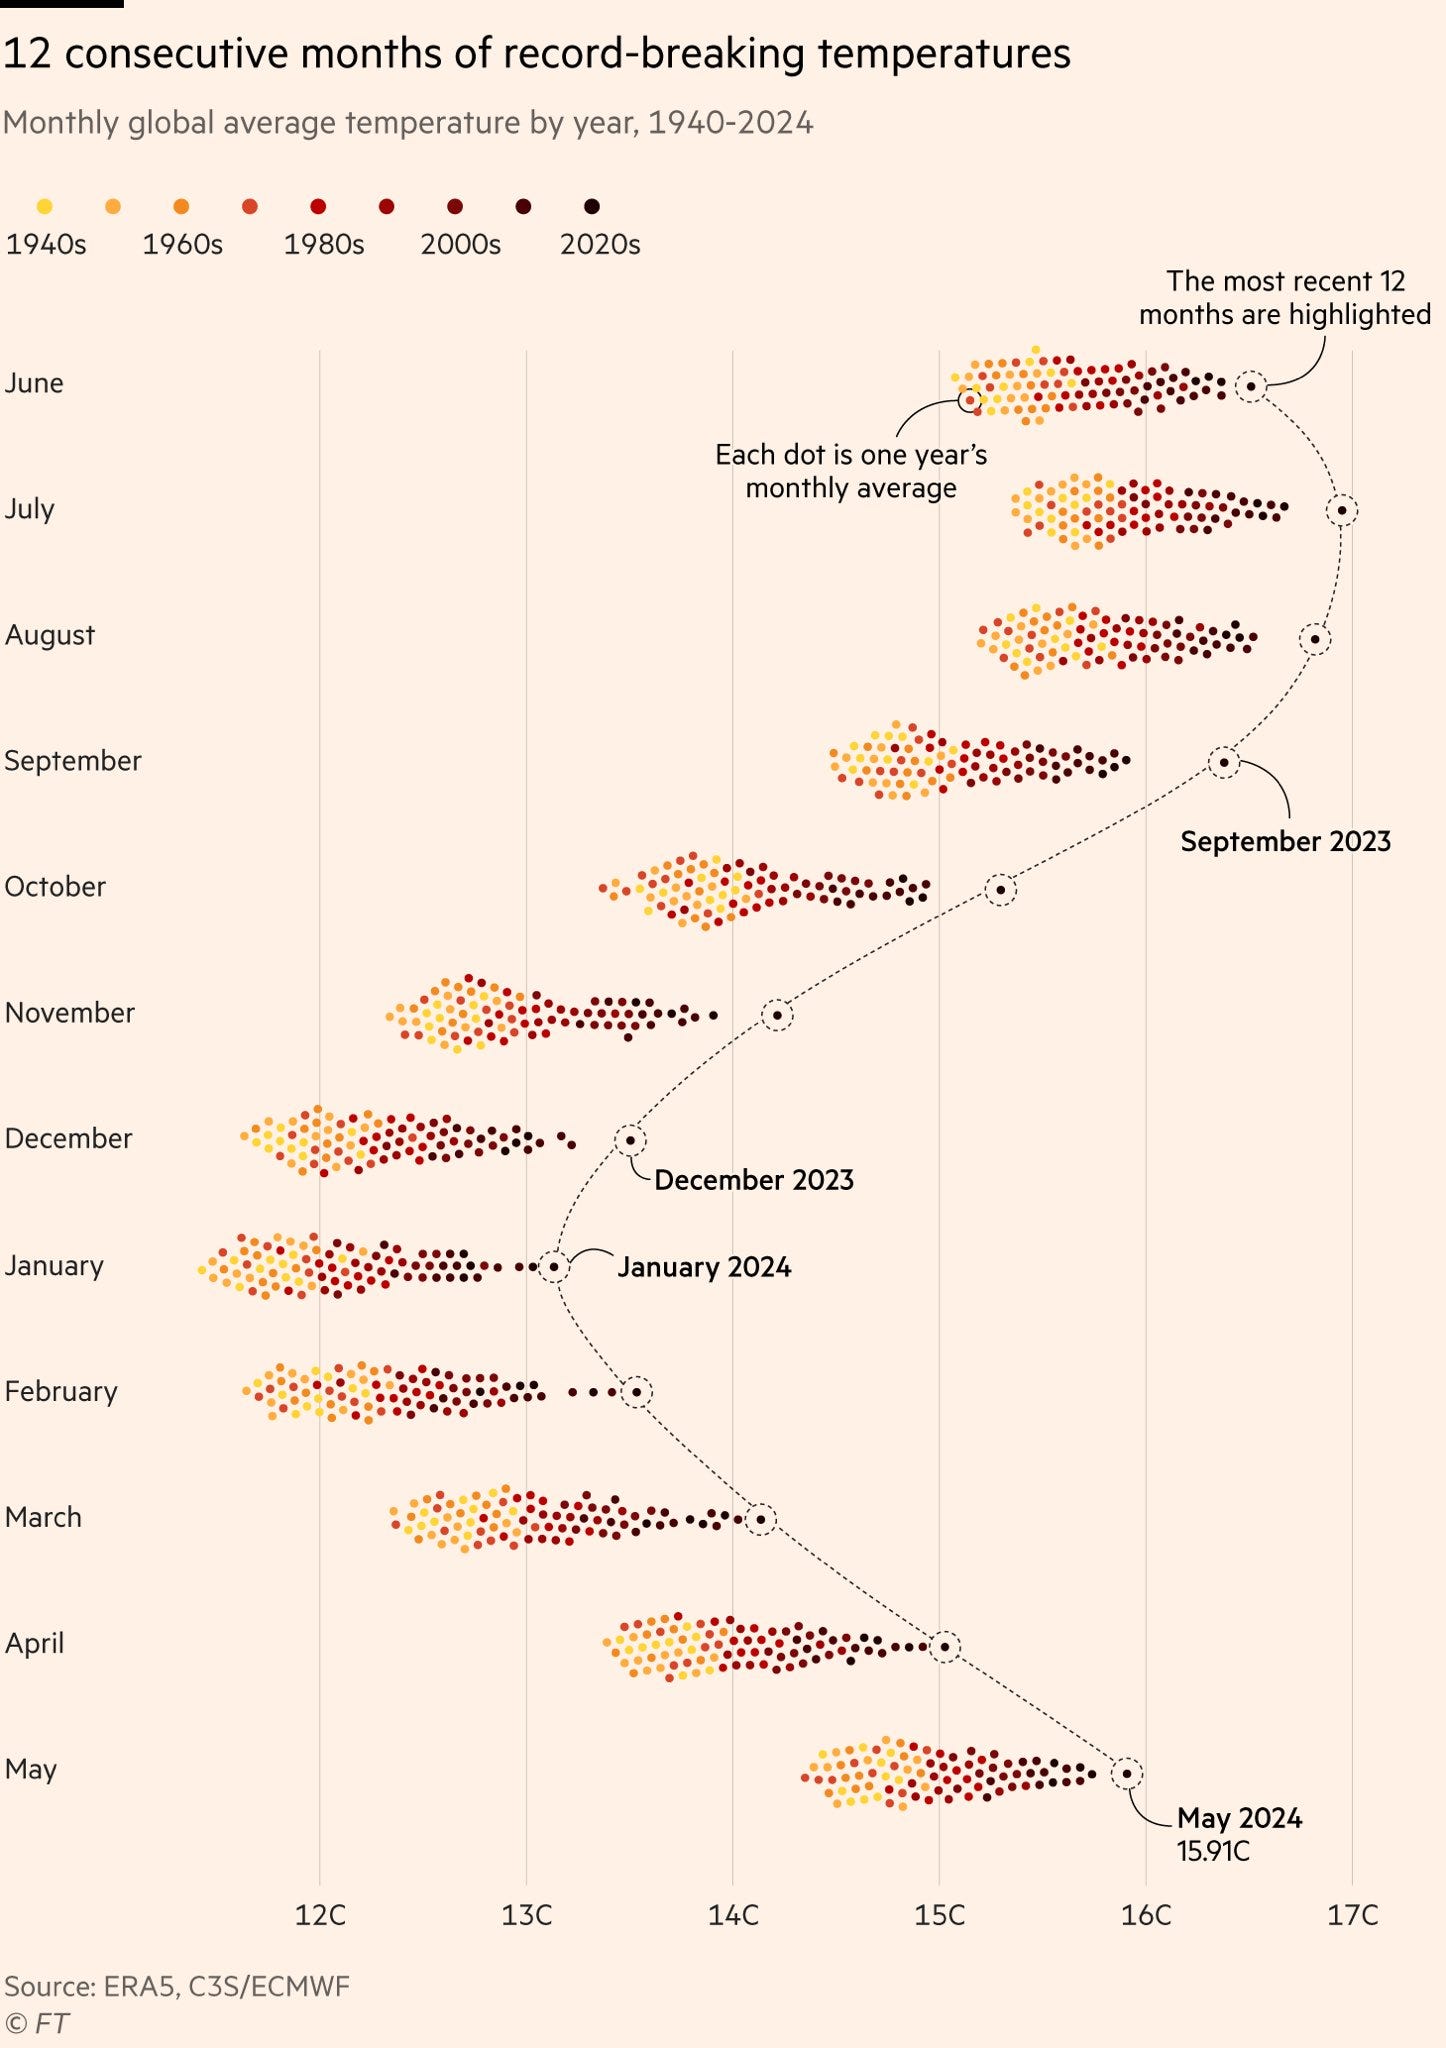
- As the global oceans experienced a 14th-straight month of warming, May 2024 marked 12 months of record-breaking global temperatures.
4. Click-Worthy Stuff: Check These Out 🔗
- This article (and paper) that presents Microsoft’s new AI model that is capable of predicting air pollution for the whole world, in less than a minute;
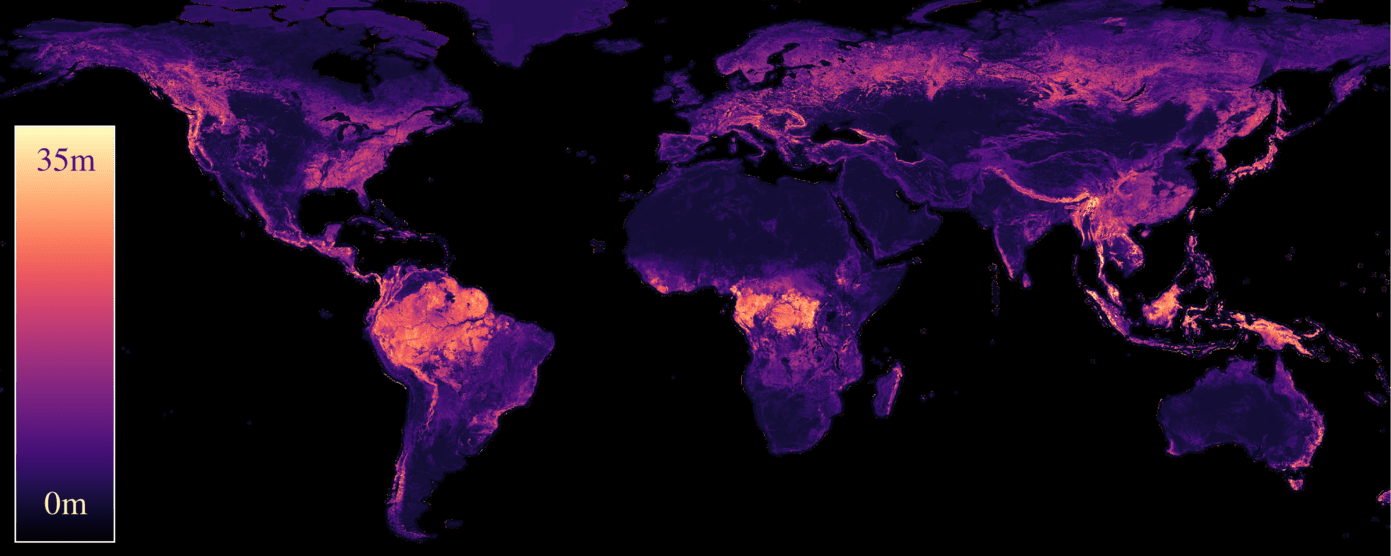
- This paper that presents a new methodology using Sentinel-1/2 and GEDI data to estimate global-scale canopy height.
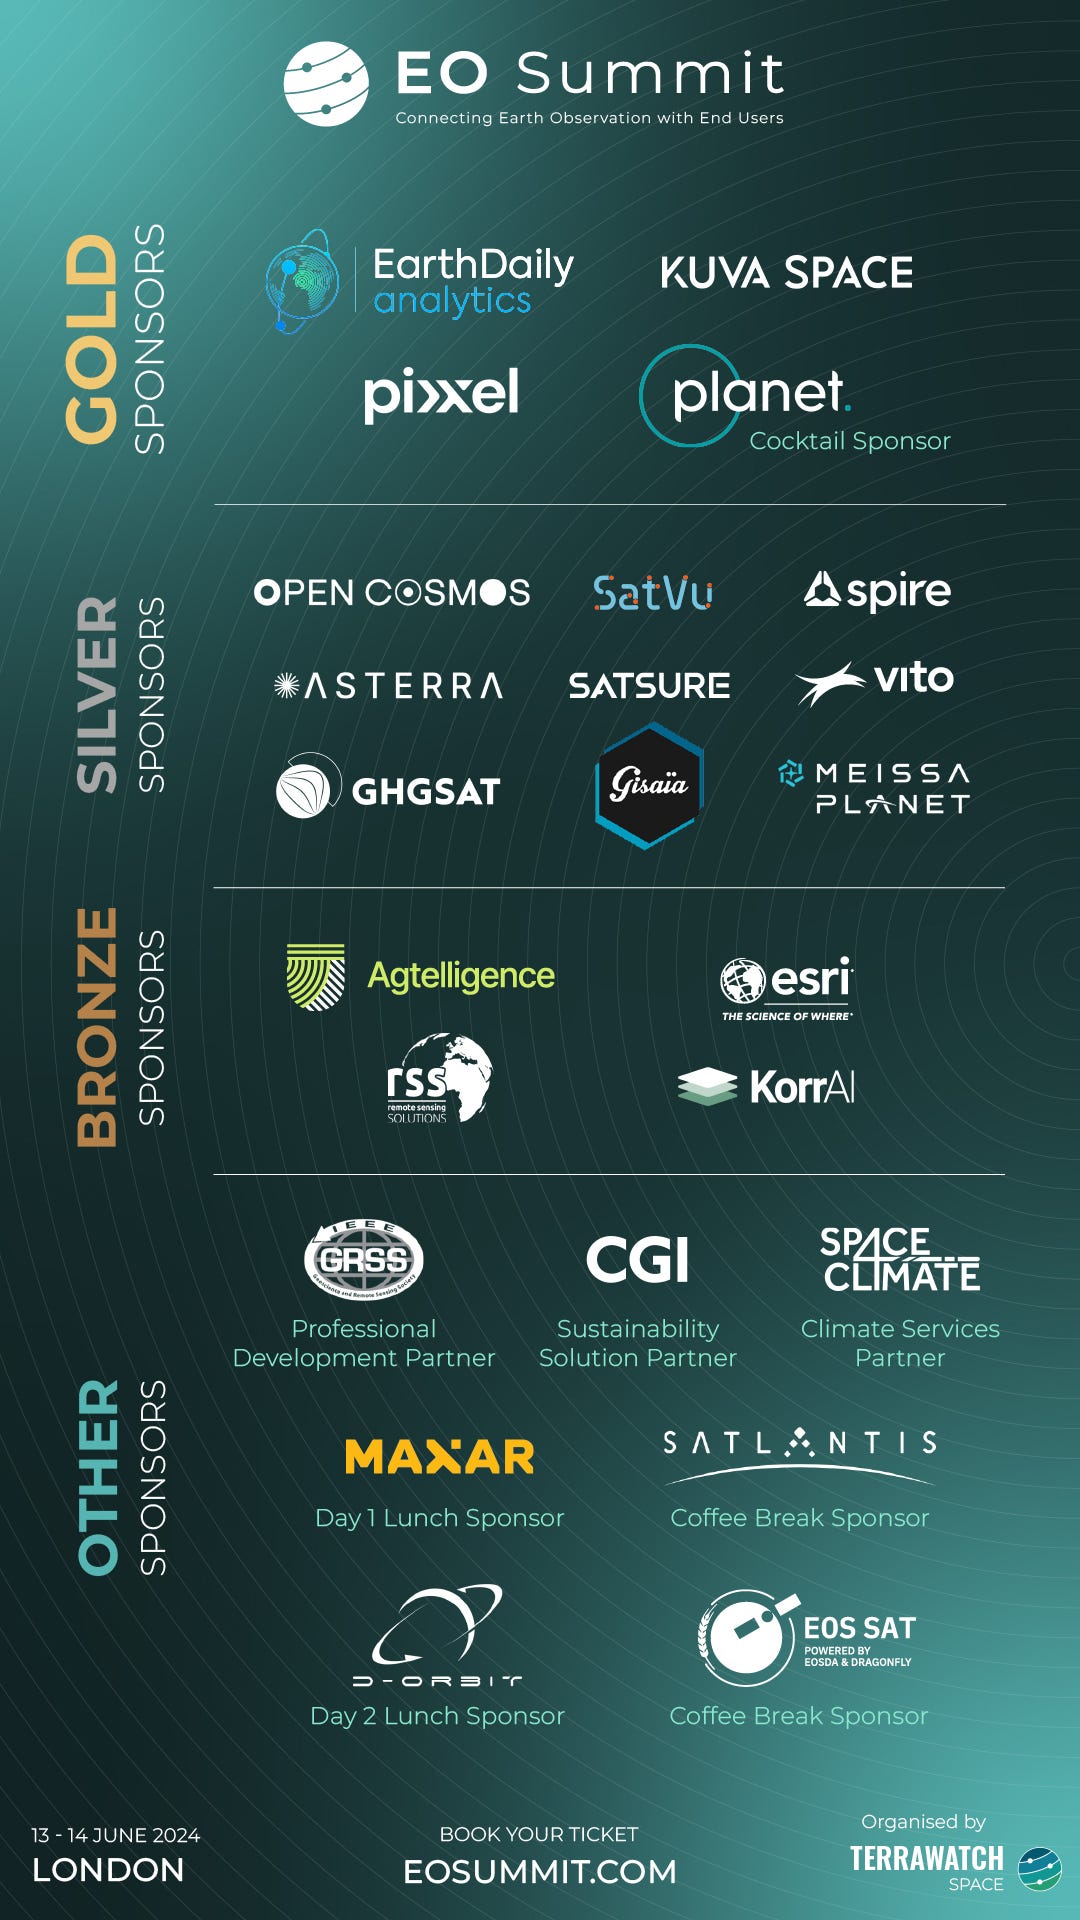
EO Summit: Thanks To Our Sponsors
The inaugural edition of the EO Summit will be held this week in London. This event would not be possible without all of our generous sponsors - a big thanks to all of them.
I have shared a lot of updates on participating organisations, speakers and sponsors over the past few weeks. Hope to meet some of you in person this week.
We are sold out - thank you for all the trust!
One Discussion Point
Exclusive analysis and insights from TerraWatch
5. The Future of EO - in the Foreground, Middle Ground or in the Background?
I have been thinking of how the EO sector continues to emphasise satellites while it communicates to the outside world, as we look for more adoption of EO in the attempt to go mainstream.
If you have read my previous posts, you might know I like to simplify (or oversimplify) things, by introducing some random terminology. I have done that again, and in this case, for defining different approaches that the EO sector is taking to become that multi-billion dollar commercial market - to be in the foreground, in the background or find and settle on a middle ground.
The figure below summarises almost everything I have to say.
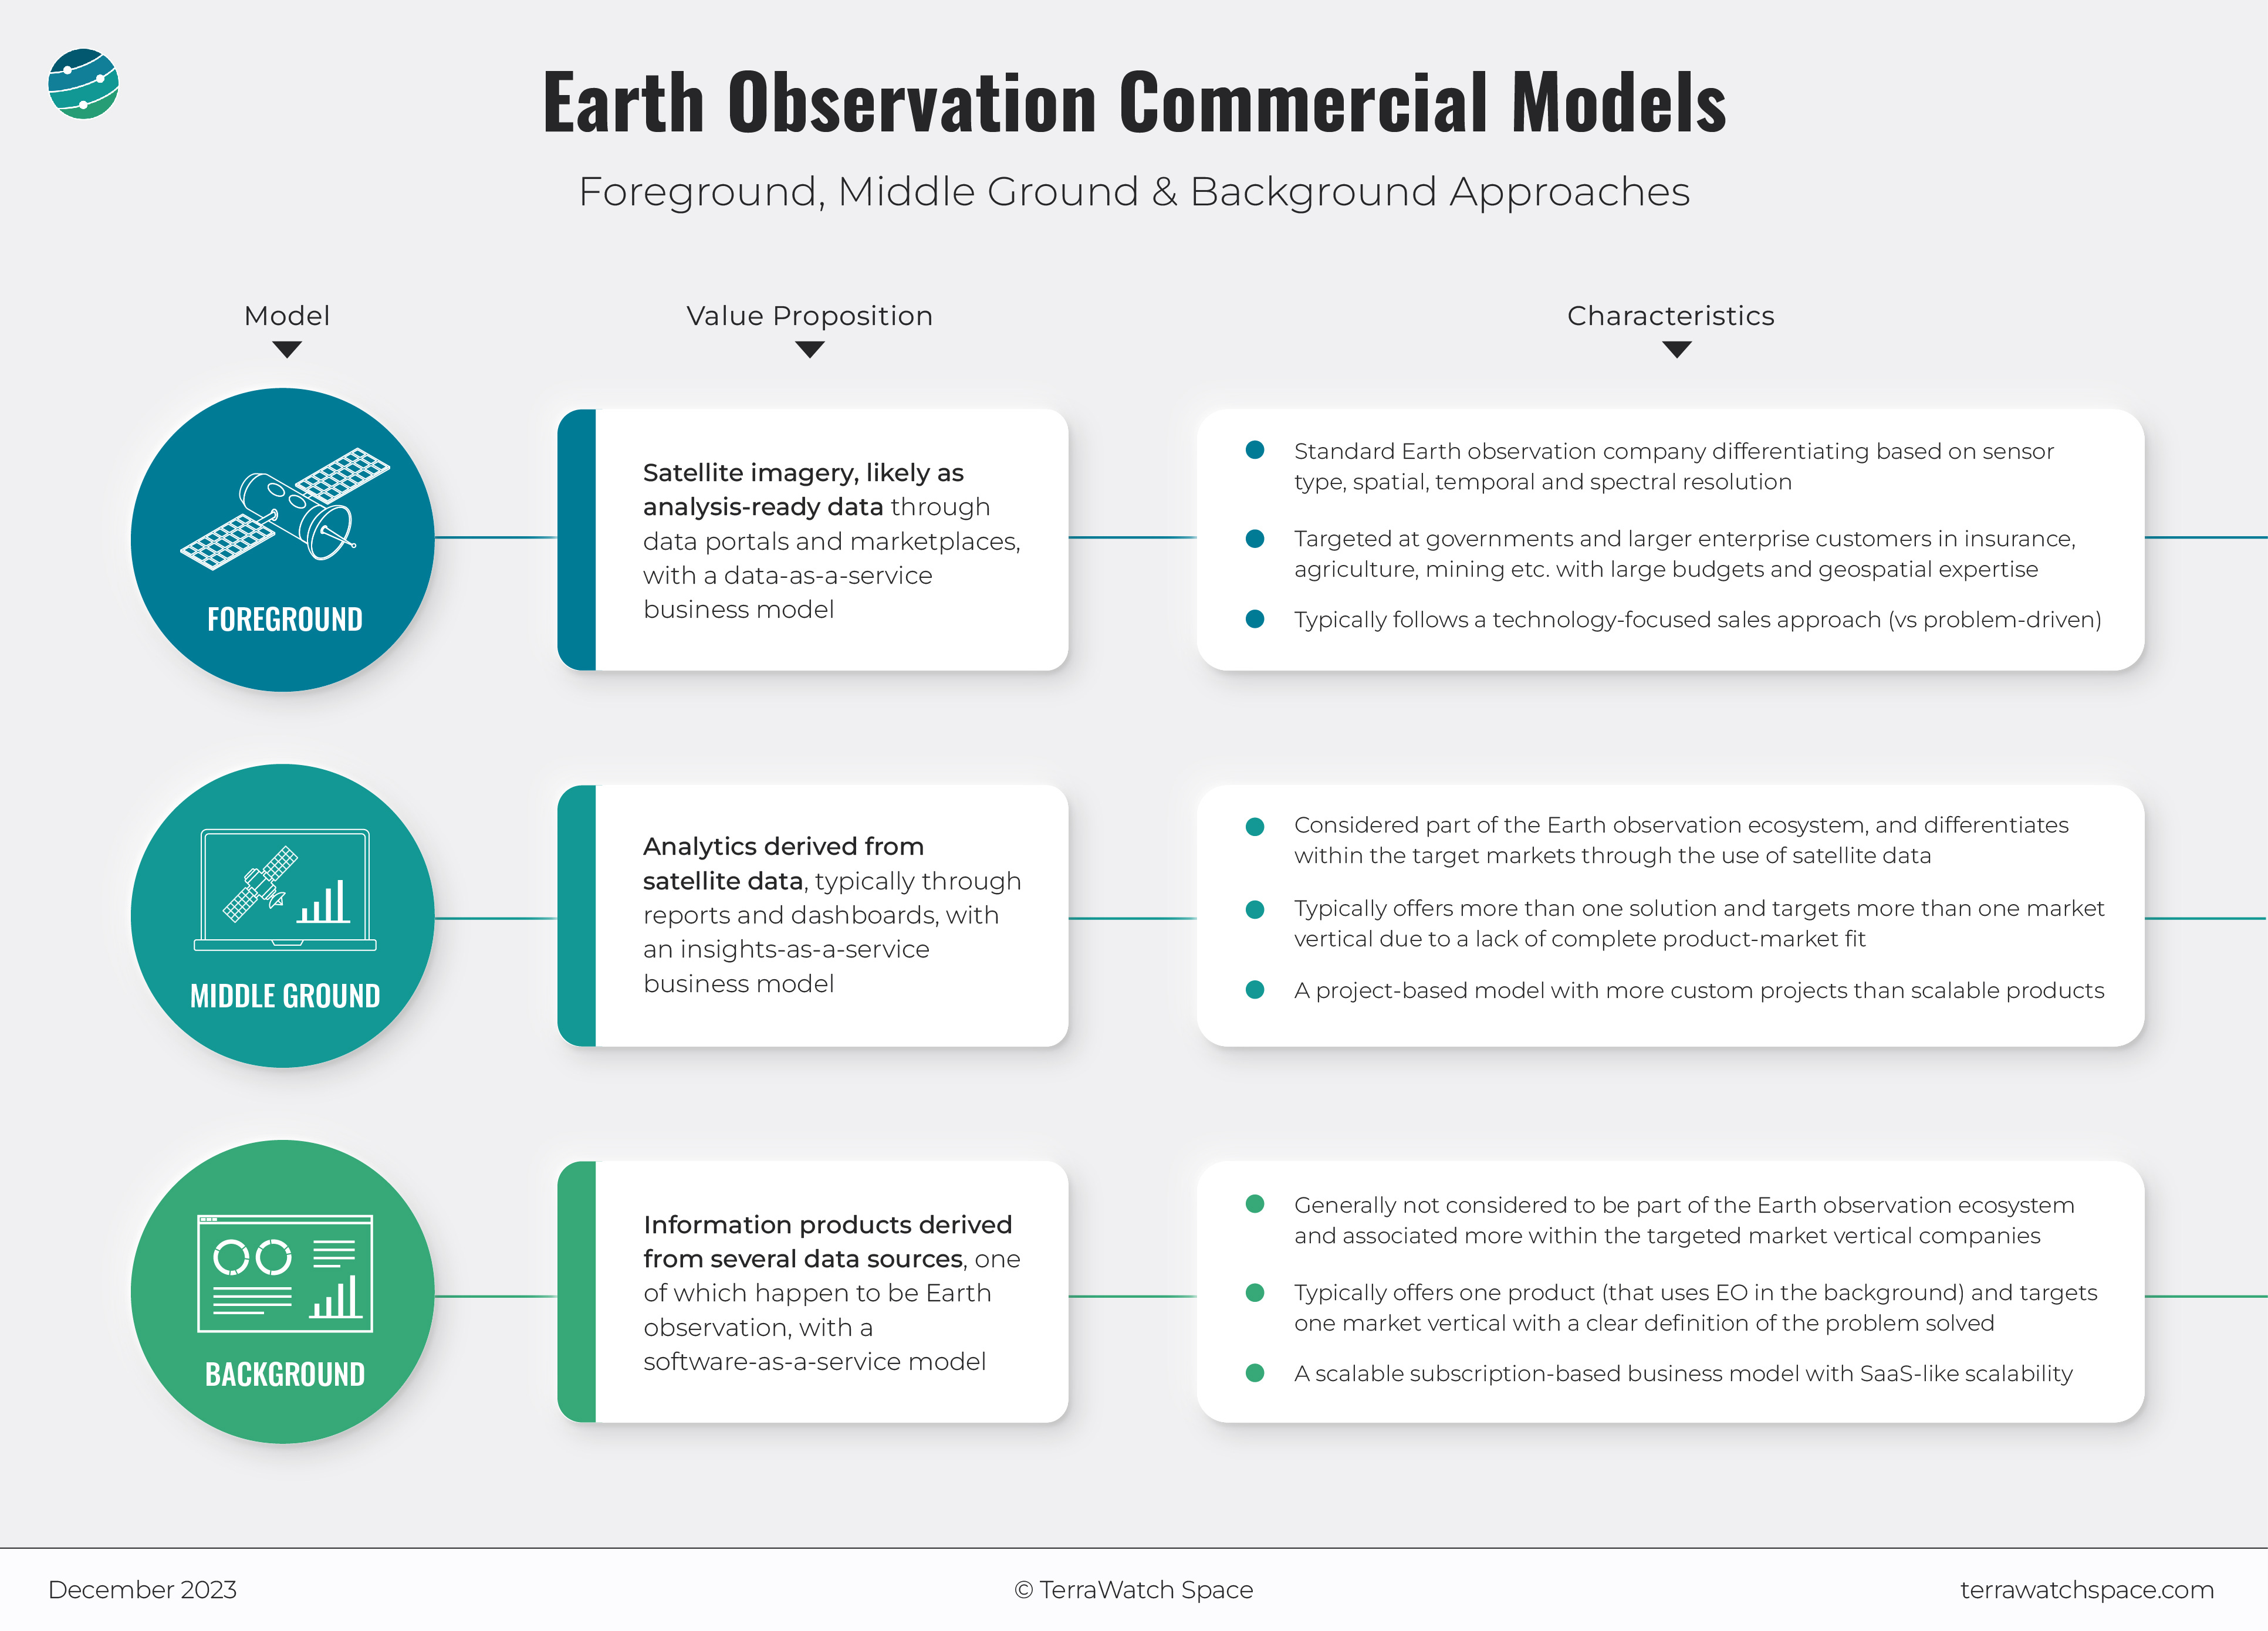
The EO in the Foreground Model
Not many folks within the larger tech industry (i.e. outside the EO community) understand remote sensing or have used geospatial data before. Convincing them to buy more EO data is probably the path to the multi-billion dollar market.
But, apart from some anchor customers who already understand the value of EO data, have strong competencies in processing it and know how to integrate it into their workflow, I am not particularly very bullish on this approach in the short term. Users are more likely to acquire a derived product (analytics) rather than try to make sense of the raw material (data).
The Middle Ground Model
There is a caveat to growth through the middle-ground approach. The larger enterprises within the specific market verticals (insurance, agriculture, financial services etc.) might decide to form their own internal EO data processing teams to build their own set of tools that perfectly respond to their needs, thereby eliminating the need for a middle ground approach.
I don’t expect this to happen anytime soon as many end-users are still in the discovery phase of understanding what the strategic value of EO is for their businesses. Once the product-market fit is established, we might see more consolidation here, with the successful EO downstream companies being acquired by the big corporations of our time (we already have a few examples of this vertical consolidation model).
The EO in the Background Model
I may have changed my mind about quite a few things ever since I started working in EO, but I have always stuck to this fact:
EO data is just another type of data that we use to build software products.
End-users, be it a consumer using a mobile application or an employee in a major corporation using an enterprise software application, do not care how they get their answers, they just want to get their “job done”.
So, this approach is what I am betting on in the long term - to consider EO data as just another source of data to build a product with, thereby making the product the selling point rather than the underlying technology itself.
A Note From a Silver Sponsor of EO Summit: SatVu
“SatVu captures the highest resolution thermal data from space for a safer and more sustainable Earth.
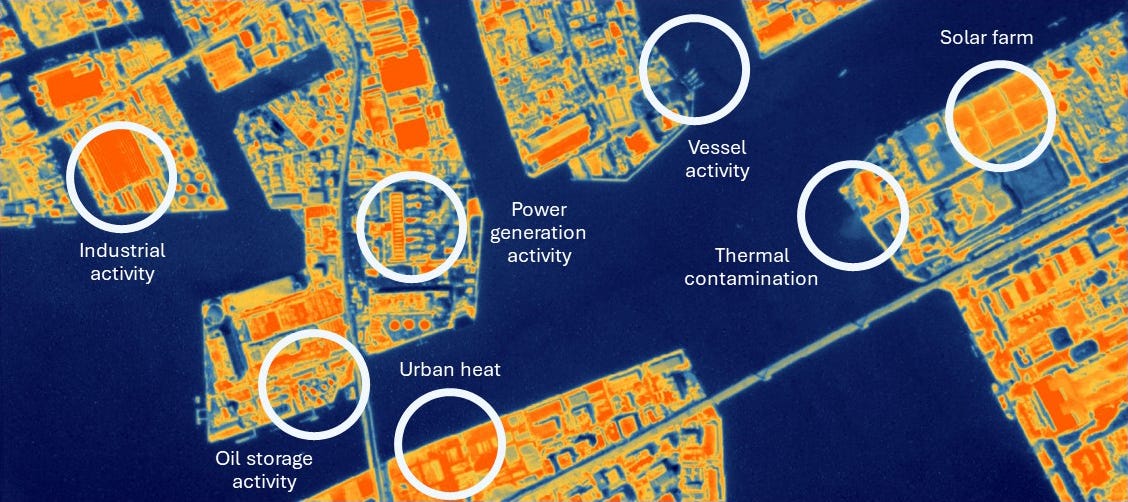
Join us at EO Summit where we’ll share our advancements in asset monitoring for the energy and utility sectors using high-resolution thermal satellite data.
Traditional monitoring methods, such as optical and SAR, have been valuable in understanding ground activities. However, thermal satellite data allows us to directly observe heat generated by various activities, providing a more detailed and accurate understanding of asset operations.
We will cover different practical applications including:
- Industrial Activity: Detecting which assets are active, even in dense setups.
- Oil Storage: Identifying operating tanks and observing pipeline activities.
- Nuclear Power Plants: Monitoring reactor-level activity.
- Port Activity: Determining the operational status of cargo vessels.
- Thermal Contamination: Observing thermal differences in industrial cooling water.
- Solar Farms: Detecting faulty panels through heat variations.
We will cover a case study of the Al Zour Refinery where using images from Hotsat-1, we observed clear activity at both plant and asset levels. This detailed monitoring helps us understand production capabilities and operational compliance.
For more information or to get involved in our user feedback programme, please get in touch.”
Scene from Space
One visual leveraging EO
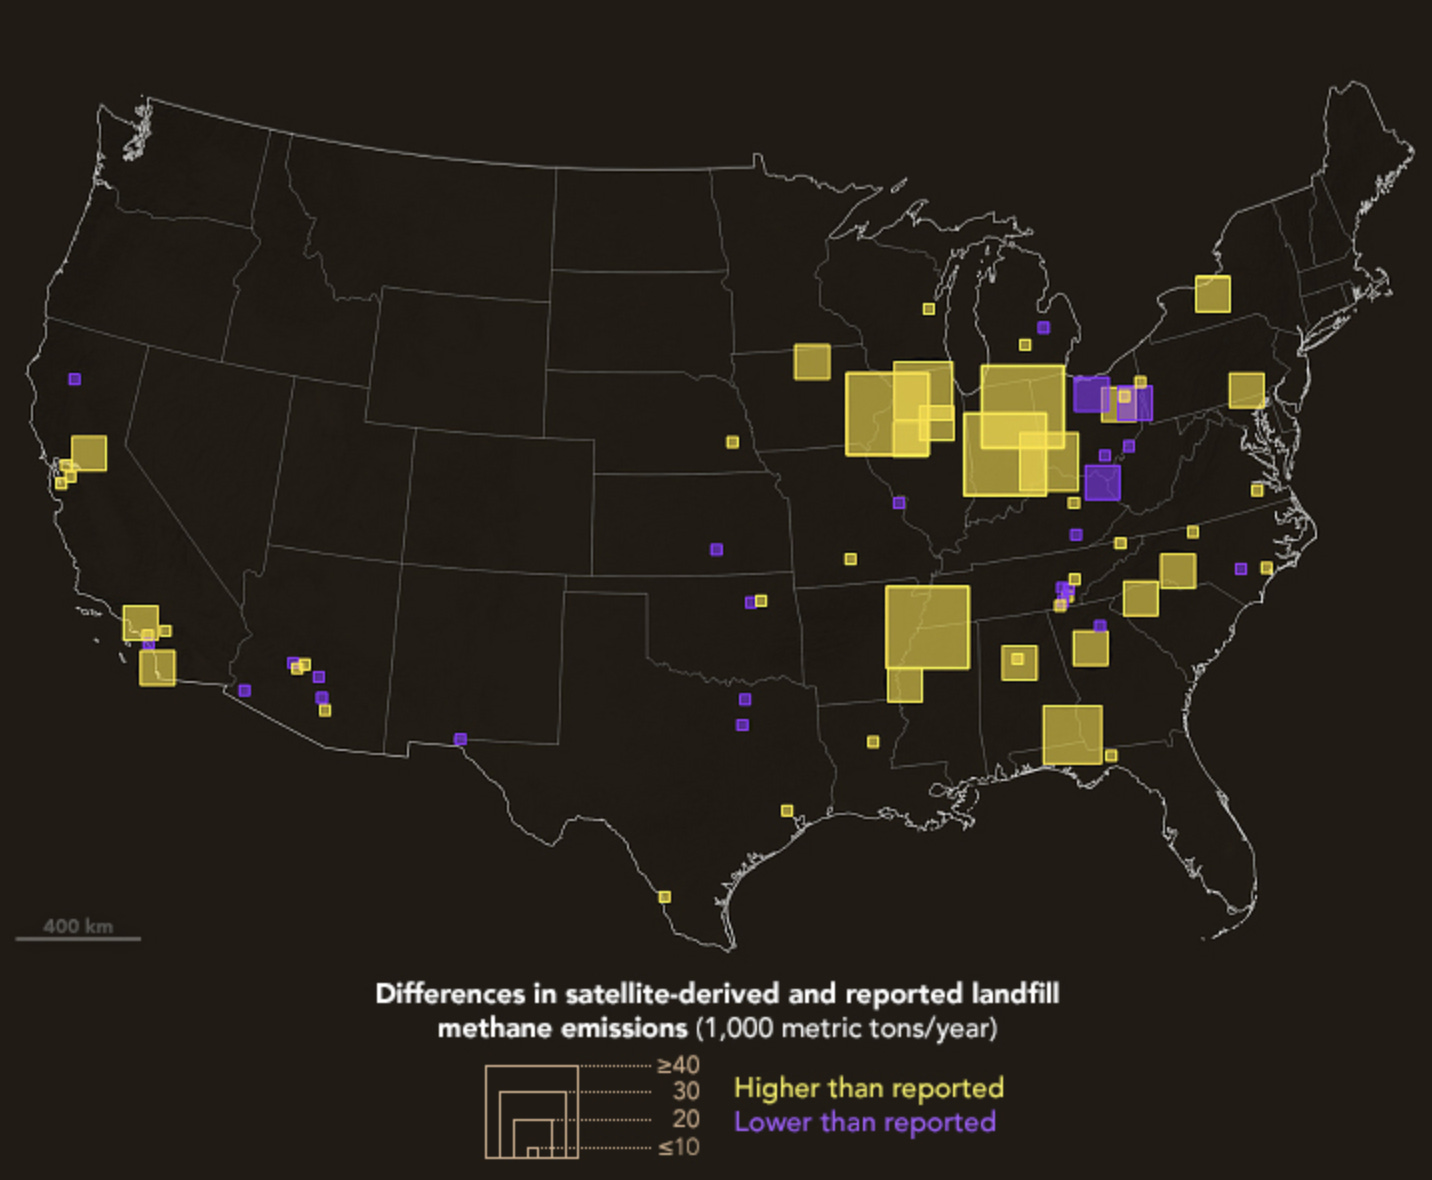
6. U.S. Methane Emissions Underestimated
An analysis from an international team of scientists found that methane emissions for the US in 2019 appeared to be 13 per cent higher than the US Environmental Protection Agency’s estimate. The team used data from the Sentinel-5P satellite and combined that with the GEOS-Chem atmospheric transport model to generate a high-resolution map of total U.S. methane emissions in 2019, through an approach that traces the path of emissions from the atmosphere back to the sources on the ground.
This is a reader-supported publication. To receive exclusive deep dives and support my work, consider becoming a paid subscriber.
Until next time,
Aravind.


