

Welcome to a new edition of ‘Last Week in Earth Observation’, containing a summary of major developments in EO from the last week and some exclusive analysis and insights from TerraWatch.
If this was forwarded, subscribe for free to get your copy every week. Already a free subscriber? Then, become a paid subscriber and get exclusive EO insights.
Four Curated Things
Major developments in EO from the past week
1. Contractual Stuff: Funding, Contracts and Deals 💰
M&A
- Norwegian ground station and satellite services firm KSAT has acquired a 70 percent majority stake in Vake, an EO-based maritime analytics provider;
Contracts
- Airbus has been awarded a contract by NASA to design and build the GRACE-C twin spacecraft, which, like the GRACE Follow-On satellites, is aimed at continuous monitoring of the Earth’s gravity field.
2. Strategic Stuff: Partnerships and Announcements 📈
Partnerships
- Planet signed a new strategic partnership agreement with SynMax, an EO-based energy and maritime intelligence firm enabling Planet to offer an analytics tool for vessel monitoring and classification;
- SatSure, via its subsidiary KaleidEO, is partnering with software-defined satellites provider ReOrbit to build an end-to-end EO infrastructure-as-a-service offering;
- Nuview which plans to launch a constellation of lidar-equipped satellites is joining hands with satellite analytics firm Ursa Space;
- Satellite infrastructure provider Loft Orbital is partnering with edge computing startup SkyServe to build EO applications on Loft’s satellite;
Announcements
Software computing firm Nvidia announced the launch of the Earth-2 Cloud Platform to enable global weather forecasting at high resolution using AI;
Early adopters include EO companies such as Spire, weather companies such as Meteomatics and meteorological agencies such as Taiwan’s Central Weather Administration.
Google announced the launch of a new flood forecasting tool that would enhance forecasts from zero to five days, specifically improving forecasts across regions in Africa and Asia;
Maxar announced that the long-delayed launch of the WorldView Legion satellites is happening, with the first two birds to launch this spring.
3. Interesting Stuff: More News 🗞️
- The US Geological Survey and Australia plan to collaborate for the Landsat Next satellite mission;
- The launch of the NASA-ISRO SAR satellite is delayed due to antenna work;
- China launched a new batch of Yunhai-2 satellites with radio occultation sensors for weather forecasting;
- EO companies are making a case for helping the military track ground targets for battlefield awareness.
4. Click-Worthy Stuff: Check These Out 🔗
- This report from the WMO on the state of global climate in 2023;
- This piece that discusses the tension between the US Space Force, the National Reconnaissance Office and the National Geospatial-Intelligence Agency on how to split the power to buy products and services from commercial EO companies;
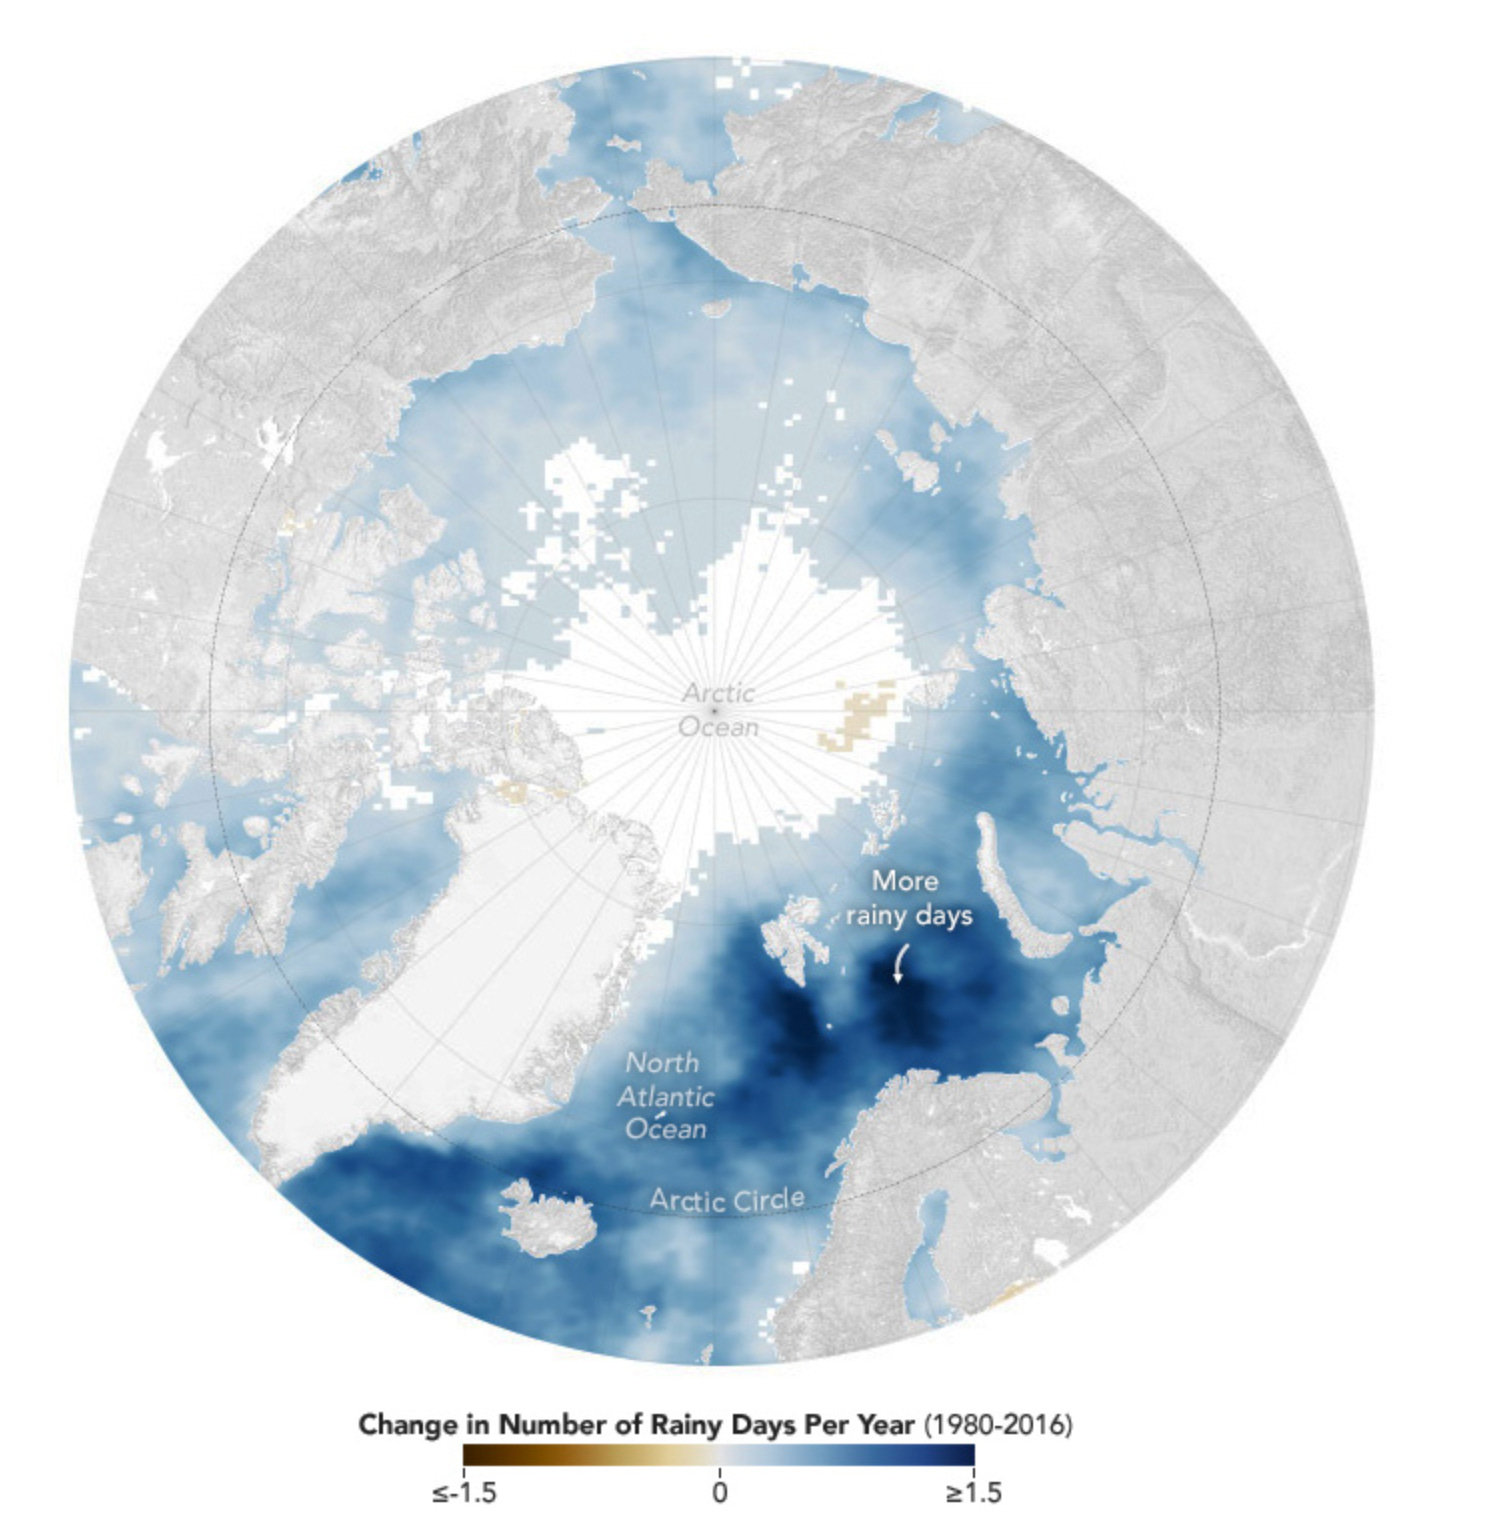
- This article that discusses how and why the Arctic is getting rainier, where normally precipitation happens as snow, thanks to data from Aqua satellite.
EO Summit: Latest Sponsors
I am excited to welcome the latest sponsors - Planet, Meissa Planet and SatVu for EO Summit. More announcements on sponsors and participating user organisations to come in the coming weeks. Stay tuned!
Tickets On Sale
Standard tickets priced at EUR 299 are on sale. Reserve your place before prices go up soon.
One EO Discussion Point
Exclusive analysis and insights from TerraWatch
5. EO for Carbon Markets
Carbon markets have been in the news, often for the wrong reasons. From shocking investigations on junk carbon credits to surprisingly well-done comedy segments, much has been said about why carbon markets will not work.
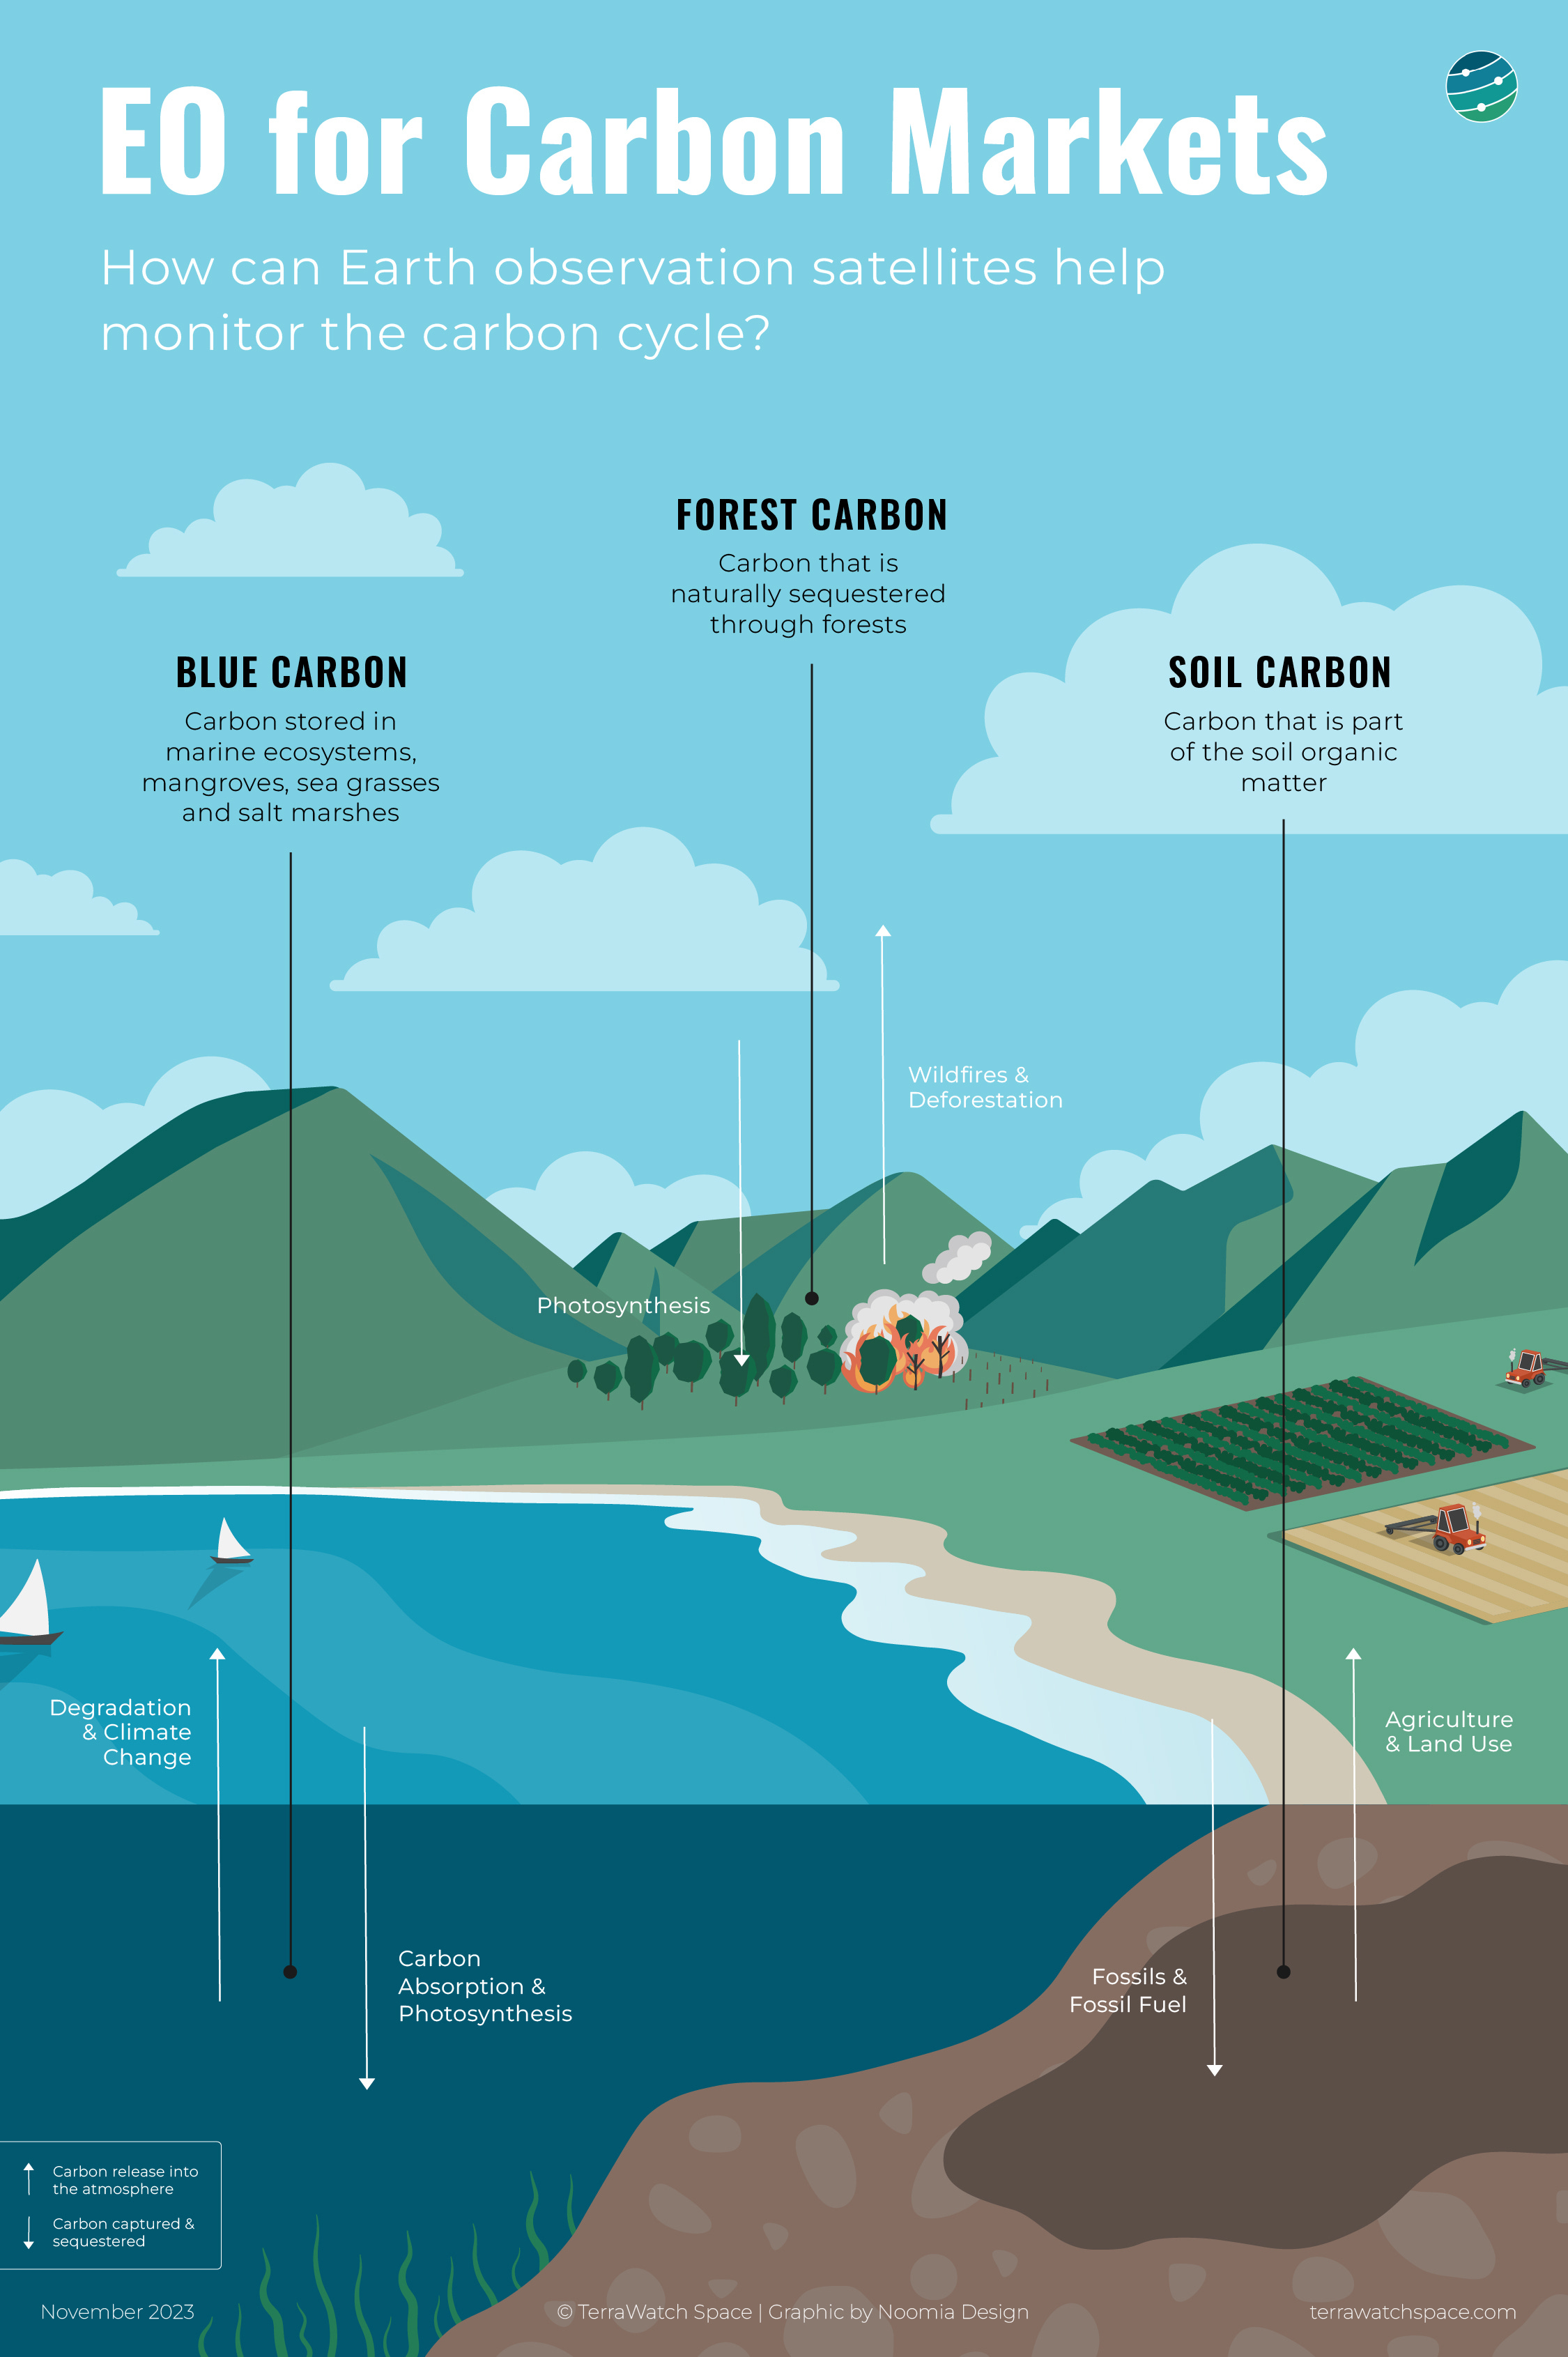
Blue Carbon, Forest Carbon and Soil Carbon
Satellites are fundamental to understanding the carbon cycle - from monitoring the carbon dioxide emissions that escape to the atmosphere to estimating the level of carbon stored in the natural environment (trees, soil, marine ecosystems). Called carbon flux, satellites are a crucial part of the system that tracks the direction and rate of flow of carbon between the oceans the atmosphere, the land, and other living things.
To simplify the role of satellites in monitoring and observing the carbon cycle, the elements of observation can be classified into three: blue carbon, forest carbon and soil carbon. The figure below shows the three categories of carbon that can be monitored and estimated using satellite data, along with examples of what they represent. Note that the figure does not attempt to demonstrate the carbon cycle in itself, but rather lists aspects of the carbon cycle that can be monitored using EO.
EO and Carbon Monitoring
The collapse of the world’s second-biggest carbon project worth nearly $100 million and the continuing revelations of the validity of several of the carbon global projects raise a larger question of whether VCMs will continue to grow, as they have and exist in their current form, over the coming years. While carbon projects related to agriculture and soil carbon might be less prone to greenwashing and junk credits, especially compared to forest carbon projects, the overall negative connotations associated with carbon offsets would require time to shave off.
From a technical perspective, however, the need for EO is not under threat. Satellites are the most objective and scalable mode of remote sensing technology, considering the global nature of carbon projects. While the need and willingness to pay for commercial EO data is still under validation, given that several open EO data sources exist that get the job done, the need for continuous monitoring and higher resolution solutions will continue to grow, especially if the carbon markets recover and demand rises.
Become a paid subscriber to read the full piece which includes a deep dive on the role of EO in the voluntary carbon market, the importance of EO in making carbon markets work and the overall commercial landscape.
Scene from Space
One visual leveraging EO
6. Analysing Sea Level Rise
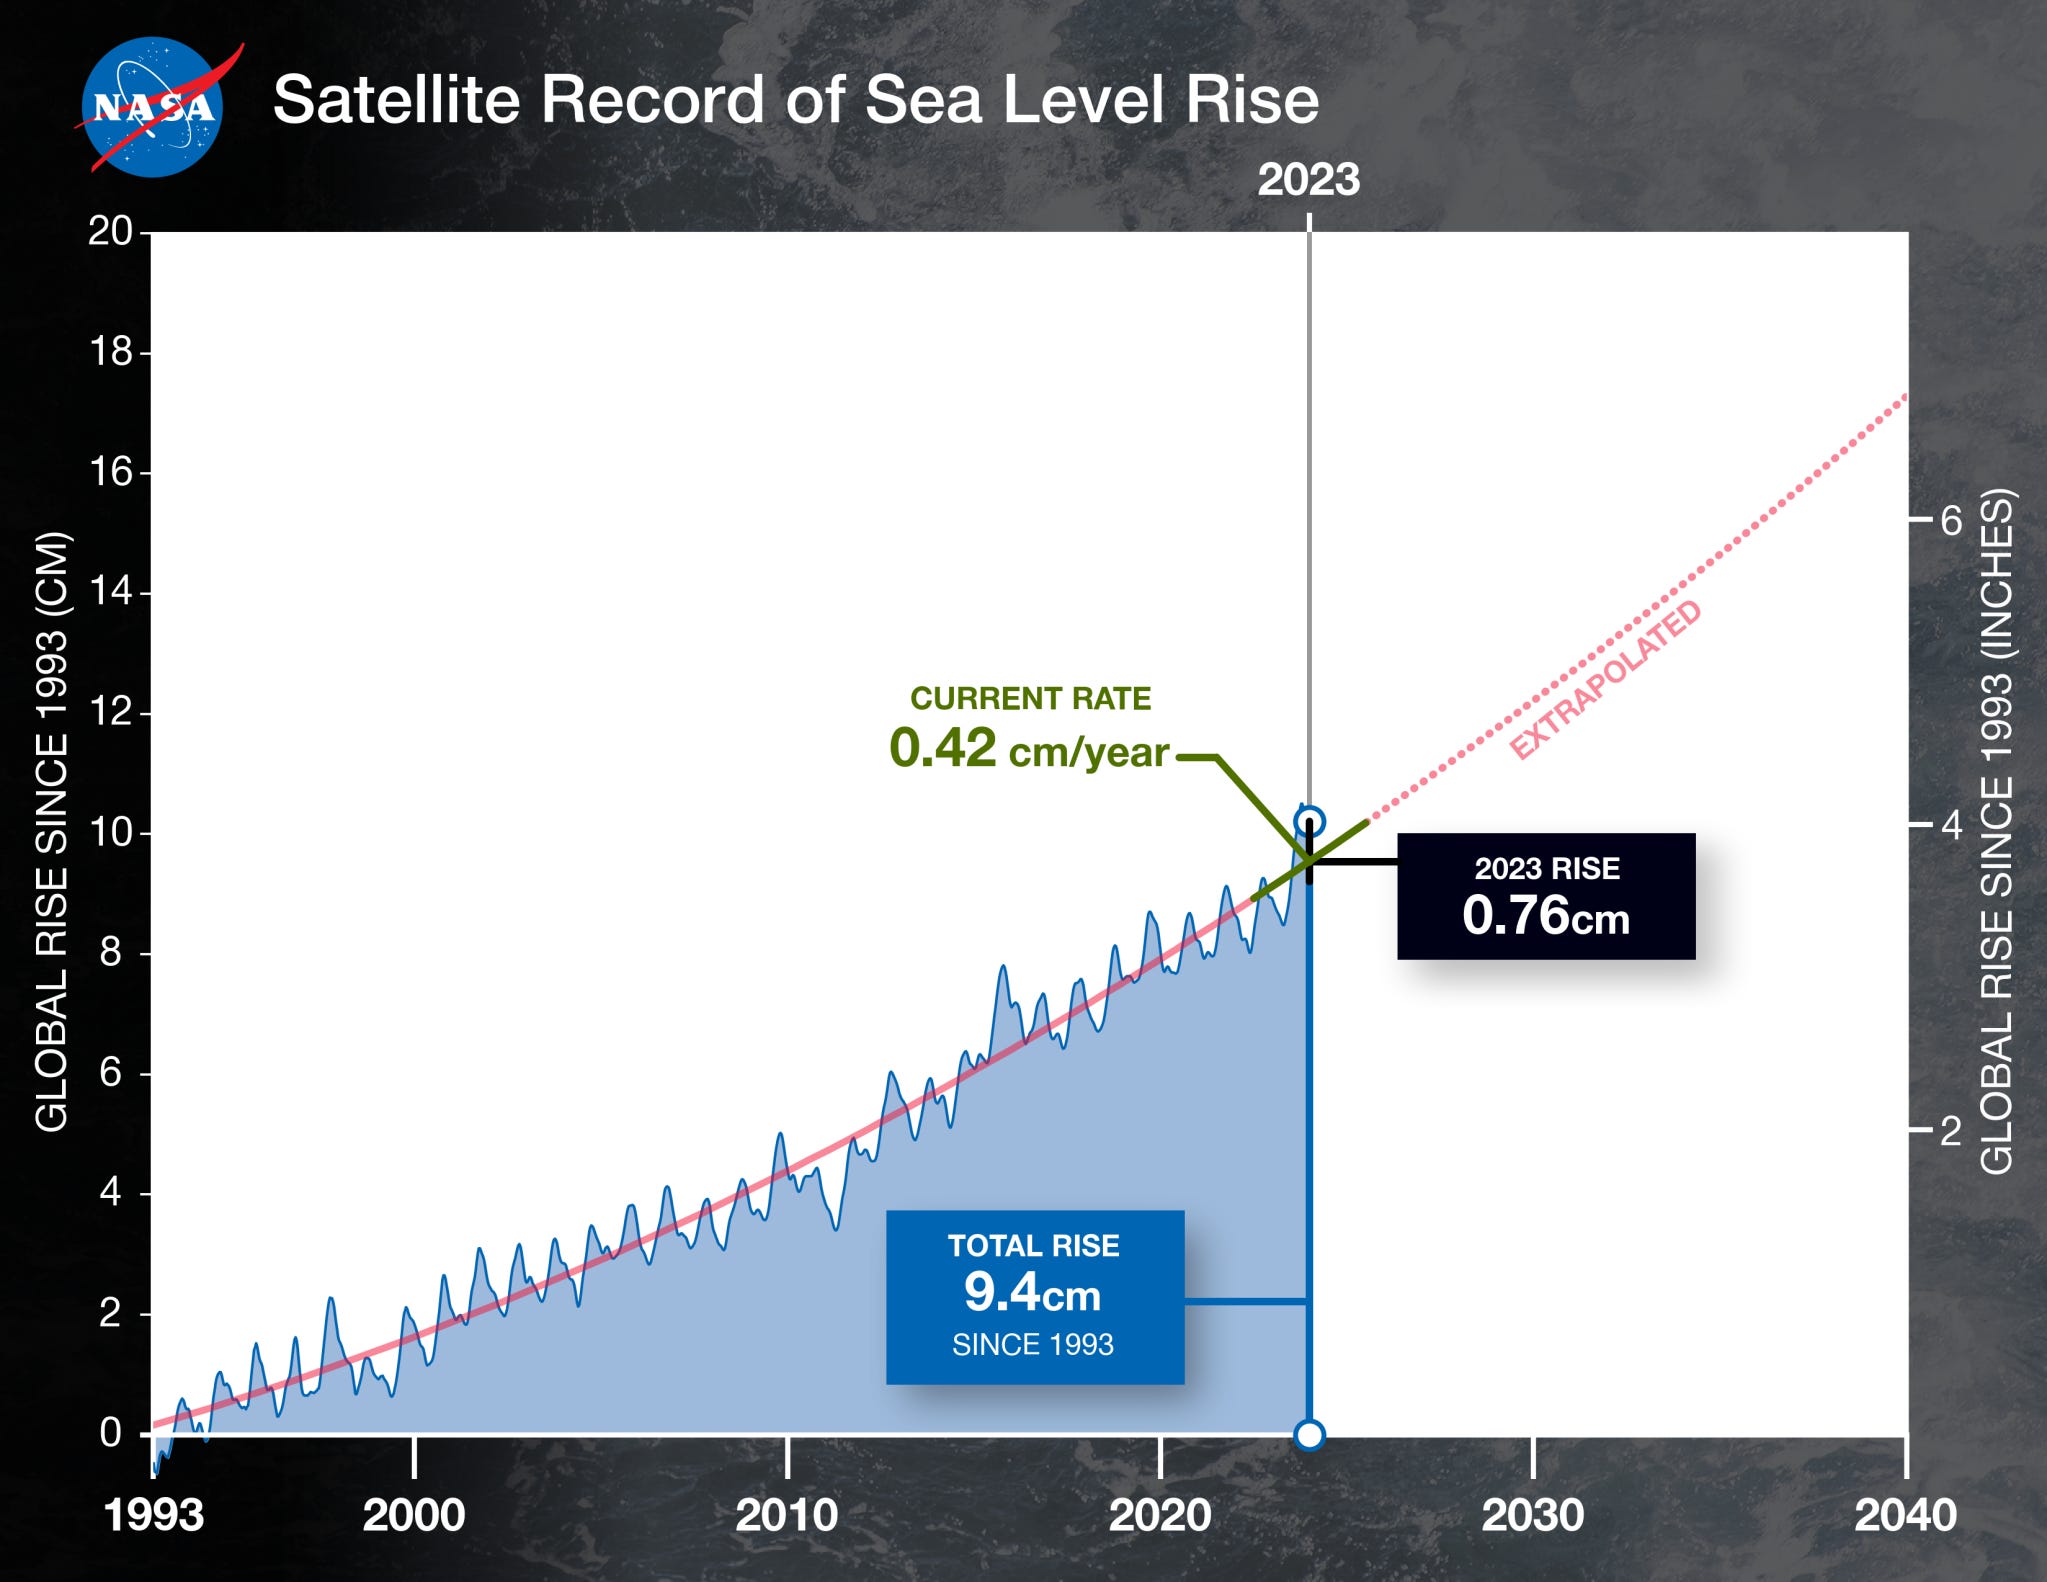
While global ocean surface temperatures continue to hit record highs for over a full year, a recent analysis from NASA found that the global average sea level rose by ~0.76 centimetres from 2022 to 2023, and a total of ~9.4 centimetres since 1993. While the yearly change is mainly a result of the switch between La Niña and El Niño conditions, the underlying trend for more than three decades has been increasing sea levels due to global warming.
The analysis is based on a sea level dataset featuring more than 30 years of satellite observations - from the TOPEX/Poseidon mission that launched in 1992 to the Sentinel-6 Michael Freilich mission that launched in 2020.
Until next time,
Aravind


