Note #1: This is an attempt at providing an overview of the state of the use of Earth observation (EO) for climate, in the commercial context. You may think of this piece as a follow-up edition to last year’s deep dive, and as always, this is not meant to be exhaustive in any way.
Note #2: This is NOT an attempt at explaining the relevance of EO for climate, from a scientific/technical standpoint. As you would imagine, this is an extremely complex topic cutting across many domains. There are several resources available from space agencies and governmental organisations for getting a general overview of this subject.
Note #3: The aim of this piece is, as I mentioned, to provide an overview of the state of EO in climate tech from a commercial point of view, and is particularly aimed at those who have limited knowledge of the use of EO for climate applications. So, if much of what you read here seems too obvious for you, then you are most likely not the target audience.
Taxonomy
Here is a list of some key terms that are used throughout the piece.
EO, as in Earth observation, is the sector that encompasses satellite data and value-added services derived from that;
Commercial includes every market opportunity with a commercial transaction (vs openly available data from governments or otherwise);
A Segment is the positioning on the EO for climate commercial landscape, shown below (data vs solutions vs applications);
AVertical is the selected industry of choice for targeting (agriculture vs insurance vs energy etc.);
Preamble
If this piece was published a few years ago, I might have needed to provide context on anthropogenic climate change, what it means, why it is happening and what we need to do. But it is 2023, and unless you have been living under a rock, you would probably notice that something is not quite right. I am writing this as wildfires are burning, global temperature records are being broken and Arctic sea ice levels are at record low levels. And we are seeing increasing proof that climate change is the reason behind most or all of this.
From a commercial standpoint, there is a lot at stake - crop failure risks are high, infrastructure risks are out of date, carbon markets are on the rise, and climate policies are being implemented - for reporting climate-related risks, nature and biodiversity related risks, supply chain risks and so on. So, it is not without reason that almost every EO company has started to position itself as a climate company. But, let’s also remember that we have a long, long way to go.
Lastly, there are several challenges to overcome in the affordability, accessibility and usability of EO - if you follow my work or writing otherwise, you will see this constantly highlighted. But, in order to keep this overview as high-level as possible, I am skipping this subject along with other market nuances - I am happy to have a chat with you separately on this. With that said, let’s go to it!
Earth Observation for Climate: Commercial Applications
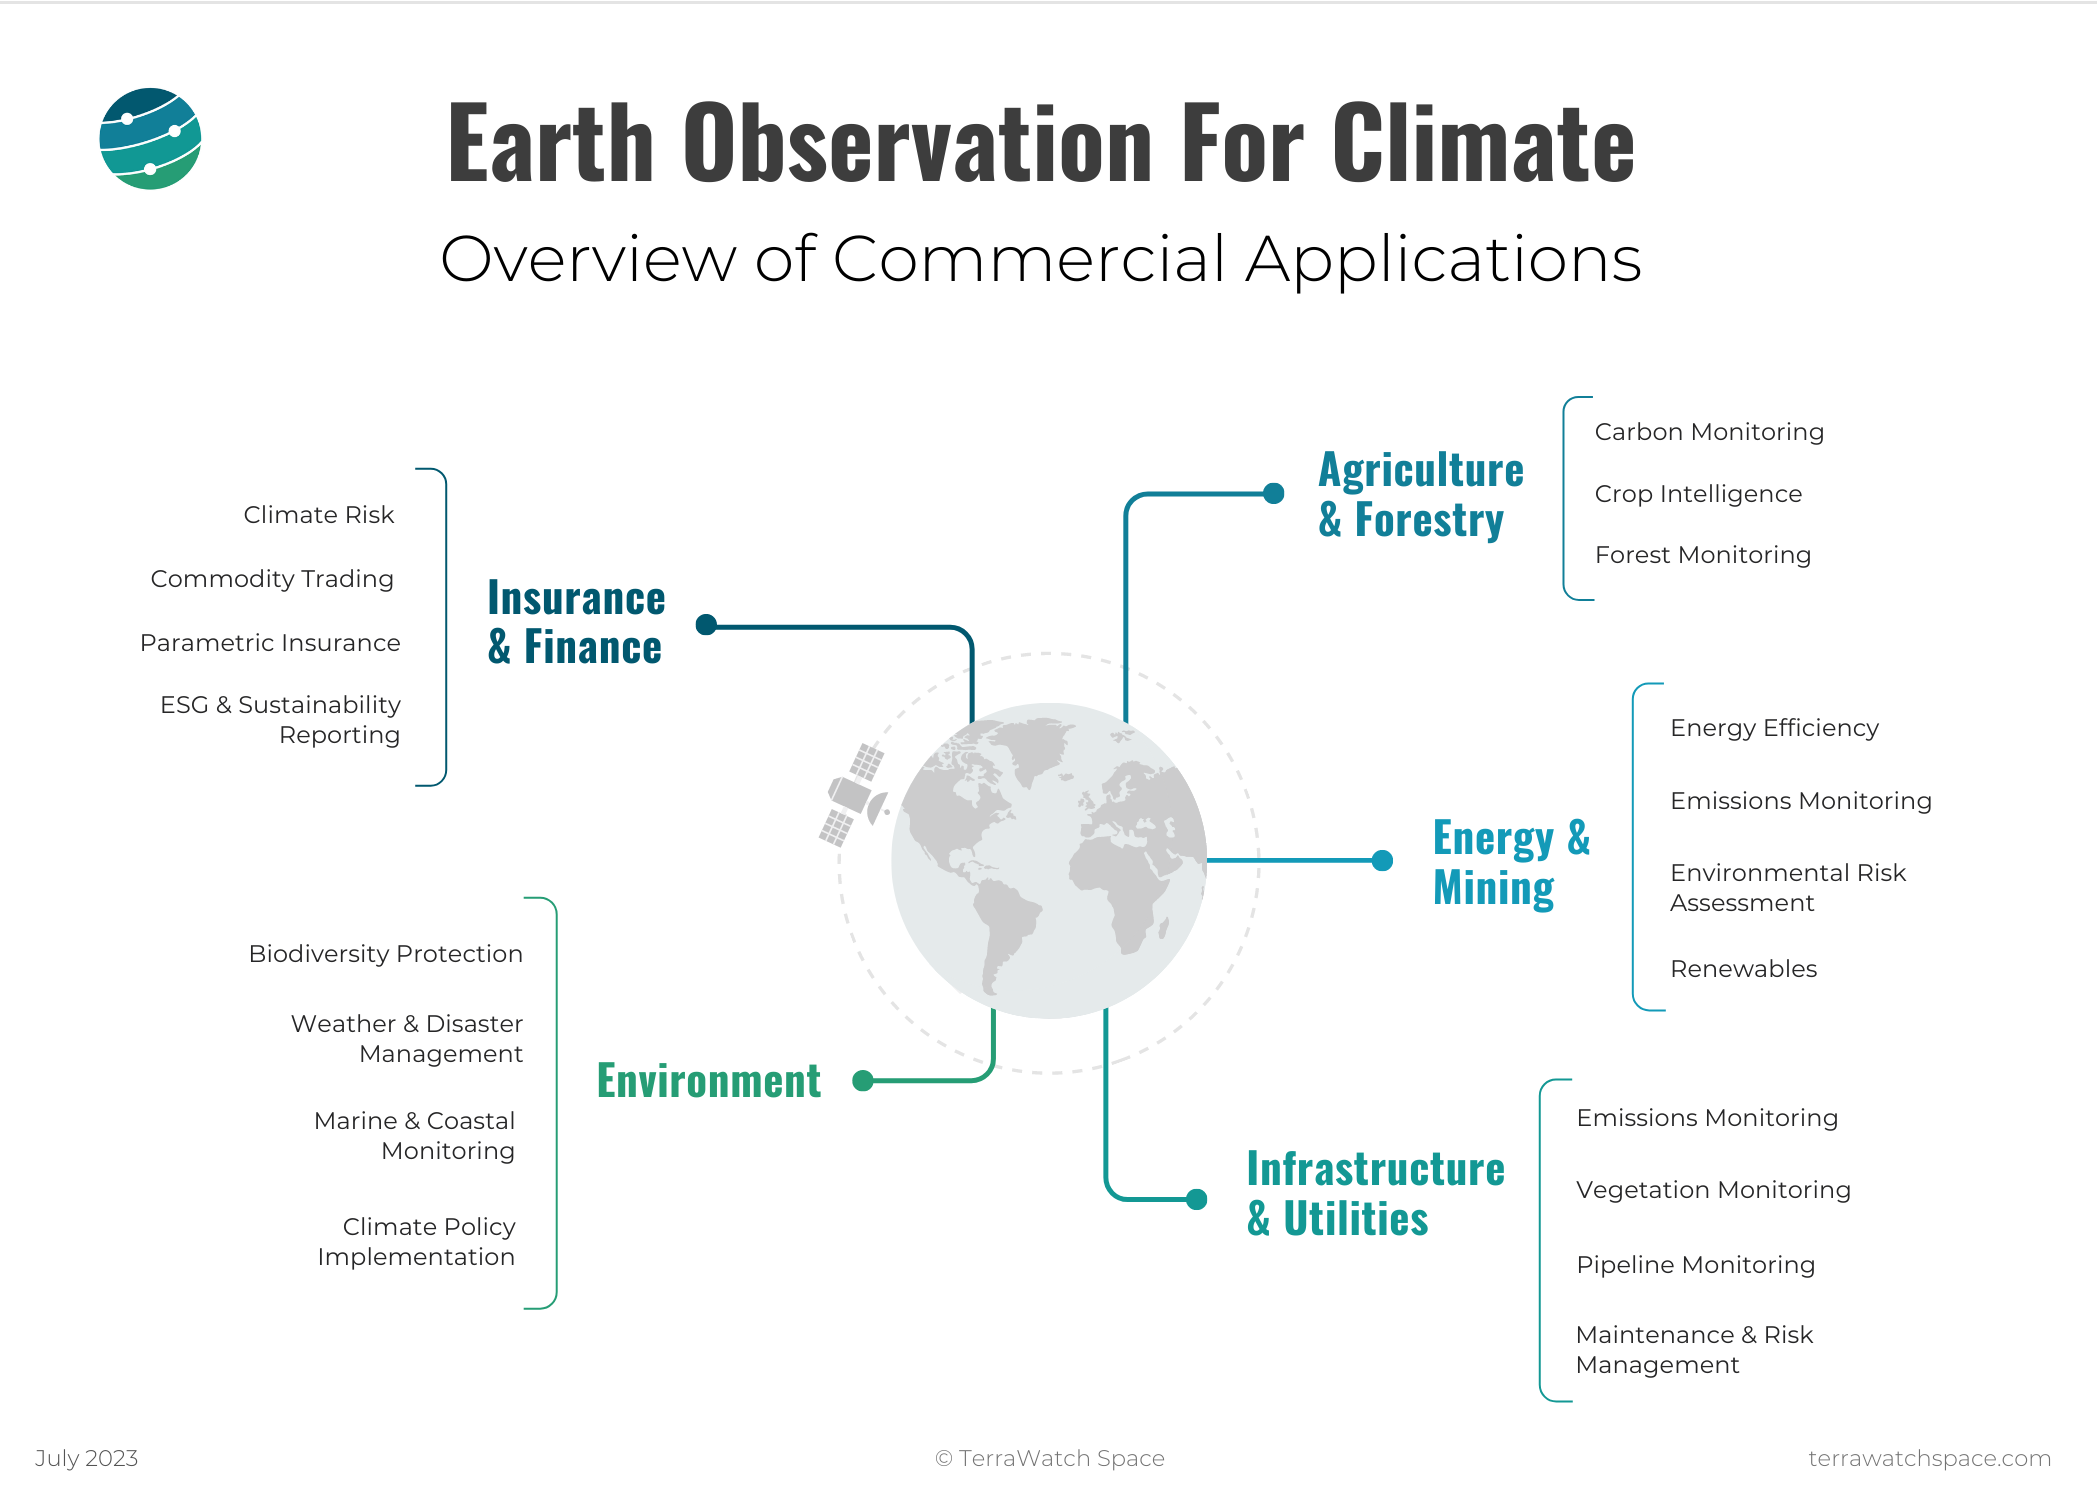
There are a number of applications of EO for climate, a few of these are specific ones while most of these are umbrella terms, meaning there is a lot to dig in.
I plan to do deep dives on some of these topics, and the use of EO within that use case, exclusively for the paid subscribers of the newsletter. So, if you are interested, take advantage of the 20% discount and upgrade now. The first deep-dive on “EO for Climate Risk” is coming out on July 31.
Verticals
There are several ways to go about analysing the commercial applications of EO for climate. I chose to go with the most straightforward way: to classify them by vertical i.e. into five, broad but logical categories. Several of these applications have already become mainstream and gained adoption commercially. The key takeaway is the contrast between the traditional applications of EO for climate and the emerging applications of EO for climate.
For instance, applications such as forest monitoring, vegetation monitoring and weather & disaster management are traditional and have been feasible and available for decades, thanks to data from missions such as Landsat, GOES and MetOP. However, given the context of climate change, these applications have gained a renewed interest commercially.
On the other hand, emerging applications such as carbon monitoring (for voluntary carbon markets), parametric insurance and emissions monitoring are more recent and are being implemented with data that is available, while several upcoming EO missions are expected to provide more data that will further support their development.

Earth Observation for Climate: Market Segments
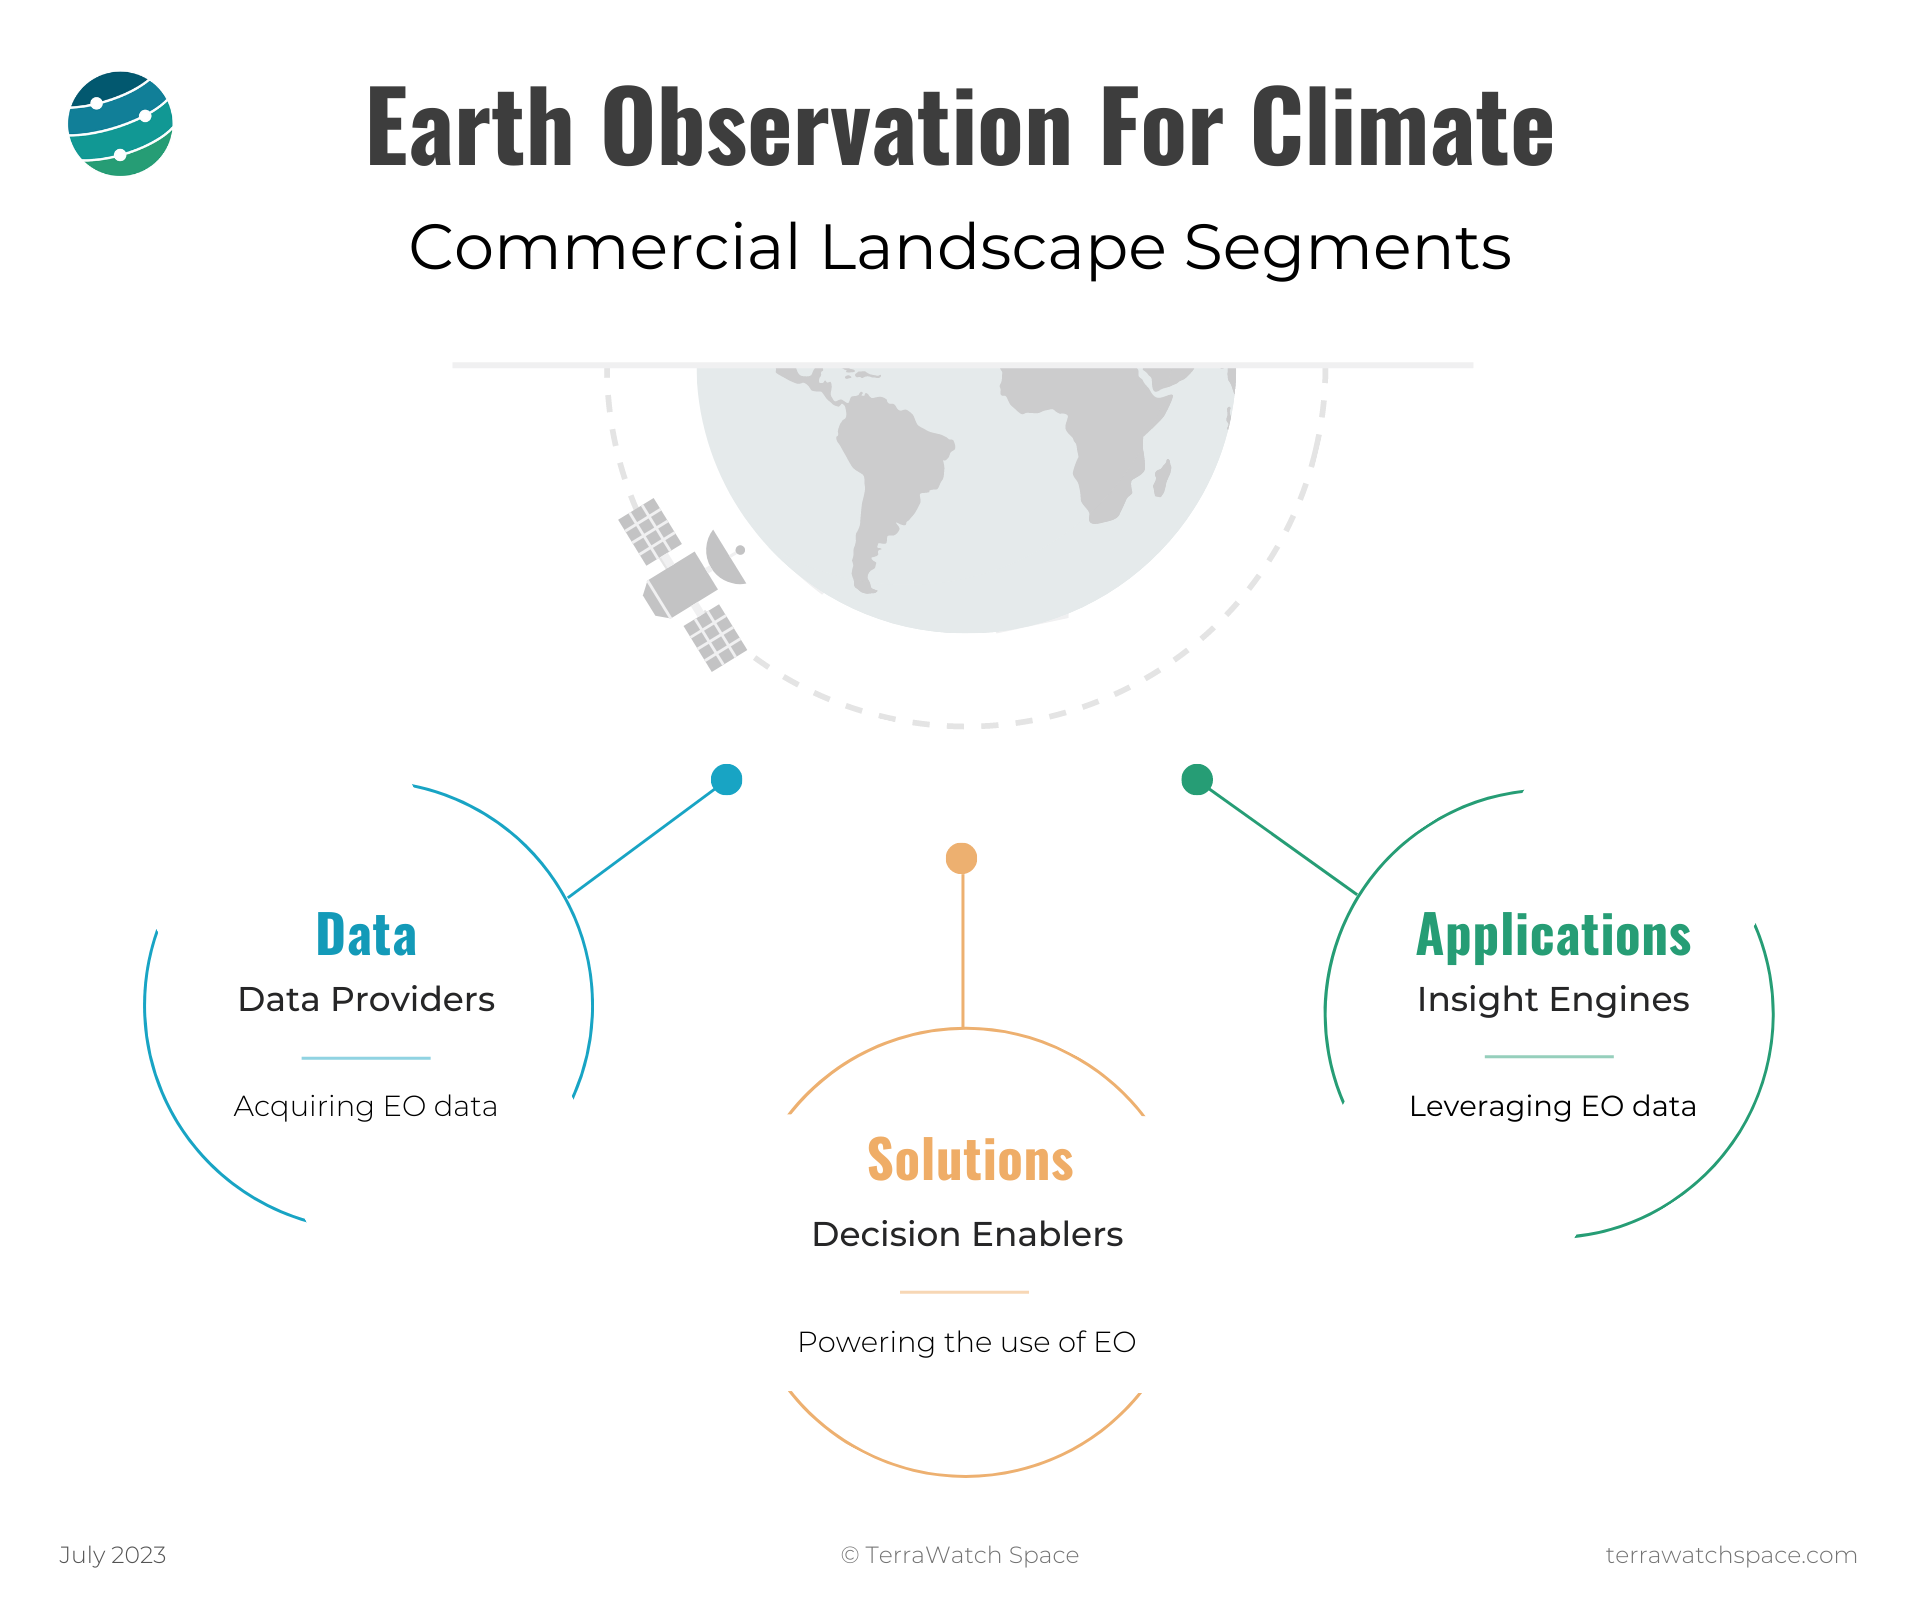
Partially derived from the TerraWatch EO value chain, I classify the commercial landscape of EO for climate into three major segments: Climate Data, Climate Solutions and Climate Applications. As you see, I simplified the segmentation I use to describe the EO industry to make it a tad more straightforward.

Climate Data: The Data Providers
This is the segment that is usually associated with the space industry - whether it is designing a remote sensing instrument to acquire a specific type of data, or launching it on a satellite and downlinking the data to the ground (read cloud). As you will see below, there is a lot of activity (and money) in this segment because you have more than one way - 6 to be precise - to launch an EO satellite today. So, expect an exponential amount of data collected from each satellite - whether they are actually fit for purpose is a whole different conversation1.
Climate Solutions: The Decision Enablers
This segment includes companies that create tools to empower users of EO to create their own climate applications. They do so by providing making EO data accessible, (through data marketplaces), fusable (through interactive platforms) and usable (through ready-made analytics). The Climate Solutions segment plays a significant role in bridging the gap between the availability of EO data and the creation of applications that are capable of providing insights. In fact, many of the existing Climate Applications use some form of a Climate Solution in order to access, process and make use of the Climate Data. So, predictably, we have quite a few of them that have been emerging in recent years.
Climate Applications: The Insight Engines
This is where things get interesting - not just because it becomes incredibly hard to track down companies that are building climate-related applications powered by EO data, but also because of the sheer possibility of all the potential applications of EO when it is combined with aerial, and drone, in-situ and other forms of data. As such, this is the hardest segment to track and unsurprisingly, the one that receives the most amount of venture capital funding. This is where the concept of verticalization becomes more relevant, especially as the deeper you dive into a vertical, the further away from EO you are likely to go2.
Earth Observation for Climate: Commercial Landscape
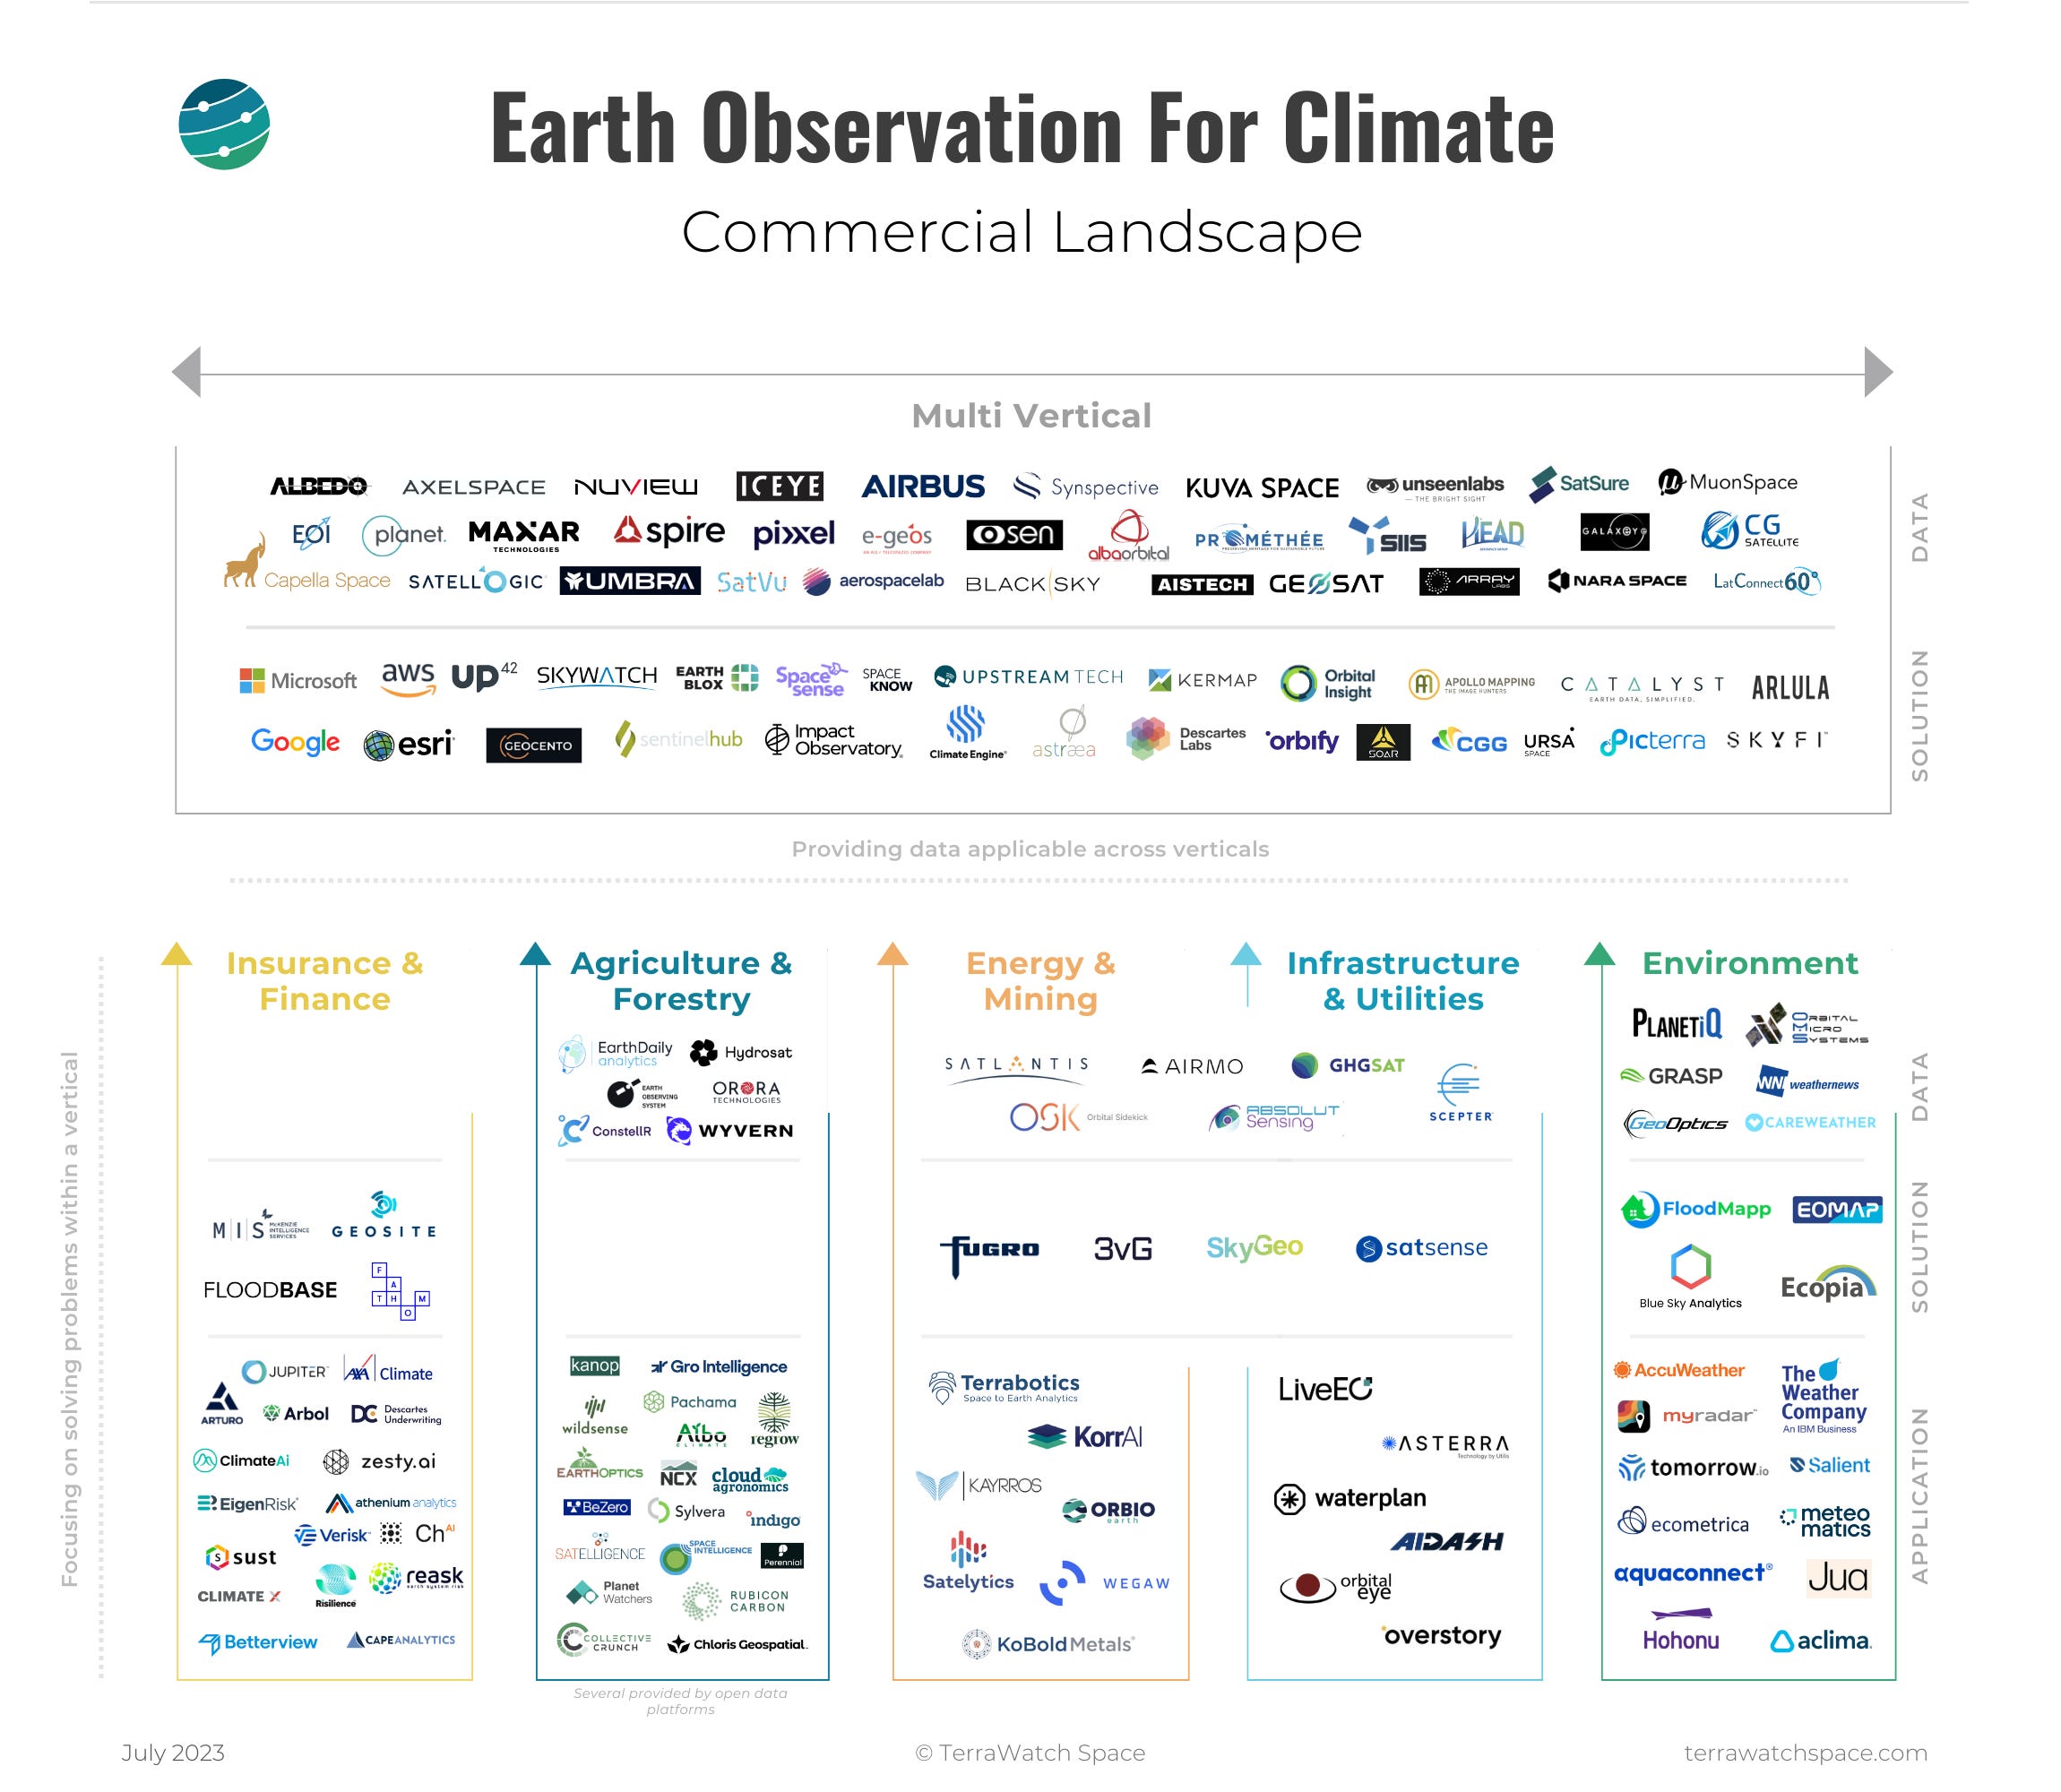
Now, here comes the tricky part, which is to try and provide an overview of the commercial landscape of EO for climate. I know your eyes will shift to the infographic, but two things to keep in mind before you go ahead.
- Positioning: The EO industry is not just incredibly fragmented, but it is also very complex and to top it all, rapidly evolving. As much as I try to position every company in the right segment, it is hard to come up with a perfect visual. Some companies you see in the figure may operate in more than one segment, but instead of making the positioning strategy the central point behind the visual, I decided to make it about the vertical strategy.
- Verticalization: EO companies tend to choose between one of two vertical strategies: horizontal (or multi-vertical) vs vertical-focused (or verticalised) strategies. This is quite crucial for climate as there are companies that are building technologies applicable to several climate applications, while there are others that tend to pick one and concentrate on that.
The following figure, which contains a non-exhaustive list of companies3, shows a snapshot of the commercial landscape visually classified into those that are multi-vertical vs those that are verticalised - in line with the verticals presented in the section above. I would recommend you take the positioning of companies, both by segment and by vertical, with a pinch of salt4. Companies typically operate in more than one segment and in more than one vertical5.
Lastly, the idea is not to list every company out there but to make sense of how the market is evolving and get an understanding of the emerging strategic trends in EO, that are relevant to climate.

Bonus: The Journey of EO - From Data to Insight
In last year’s edition, I provided a framework to understand the applications of EO for climate adaptation. As I was thinking about what to include in this year’s edition, I came across a number of conversations on social media on how EO is becoming more and more like a black box - this magical technology that spits out insights that were derived from satellite data. As I dug deeper and spoke to more outsiders of EO, I found that there were some preconceived notions of EO, which were not true, namely these couple of them:
- more data will lead to better insights, so, we need more satellites,
- data derived from satellites can directly lead to actionable insights.

What does this have to do with EO for Climate?
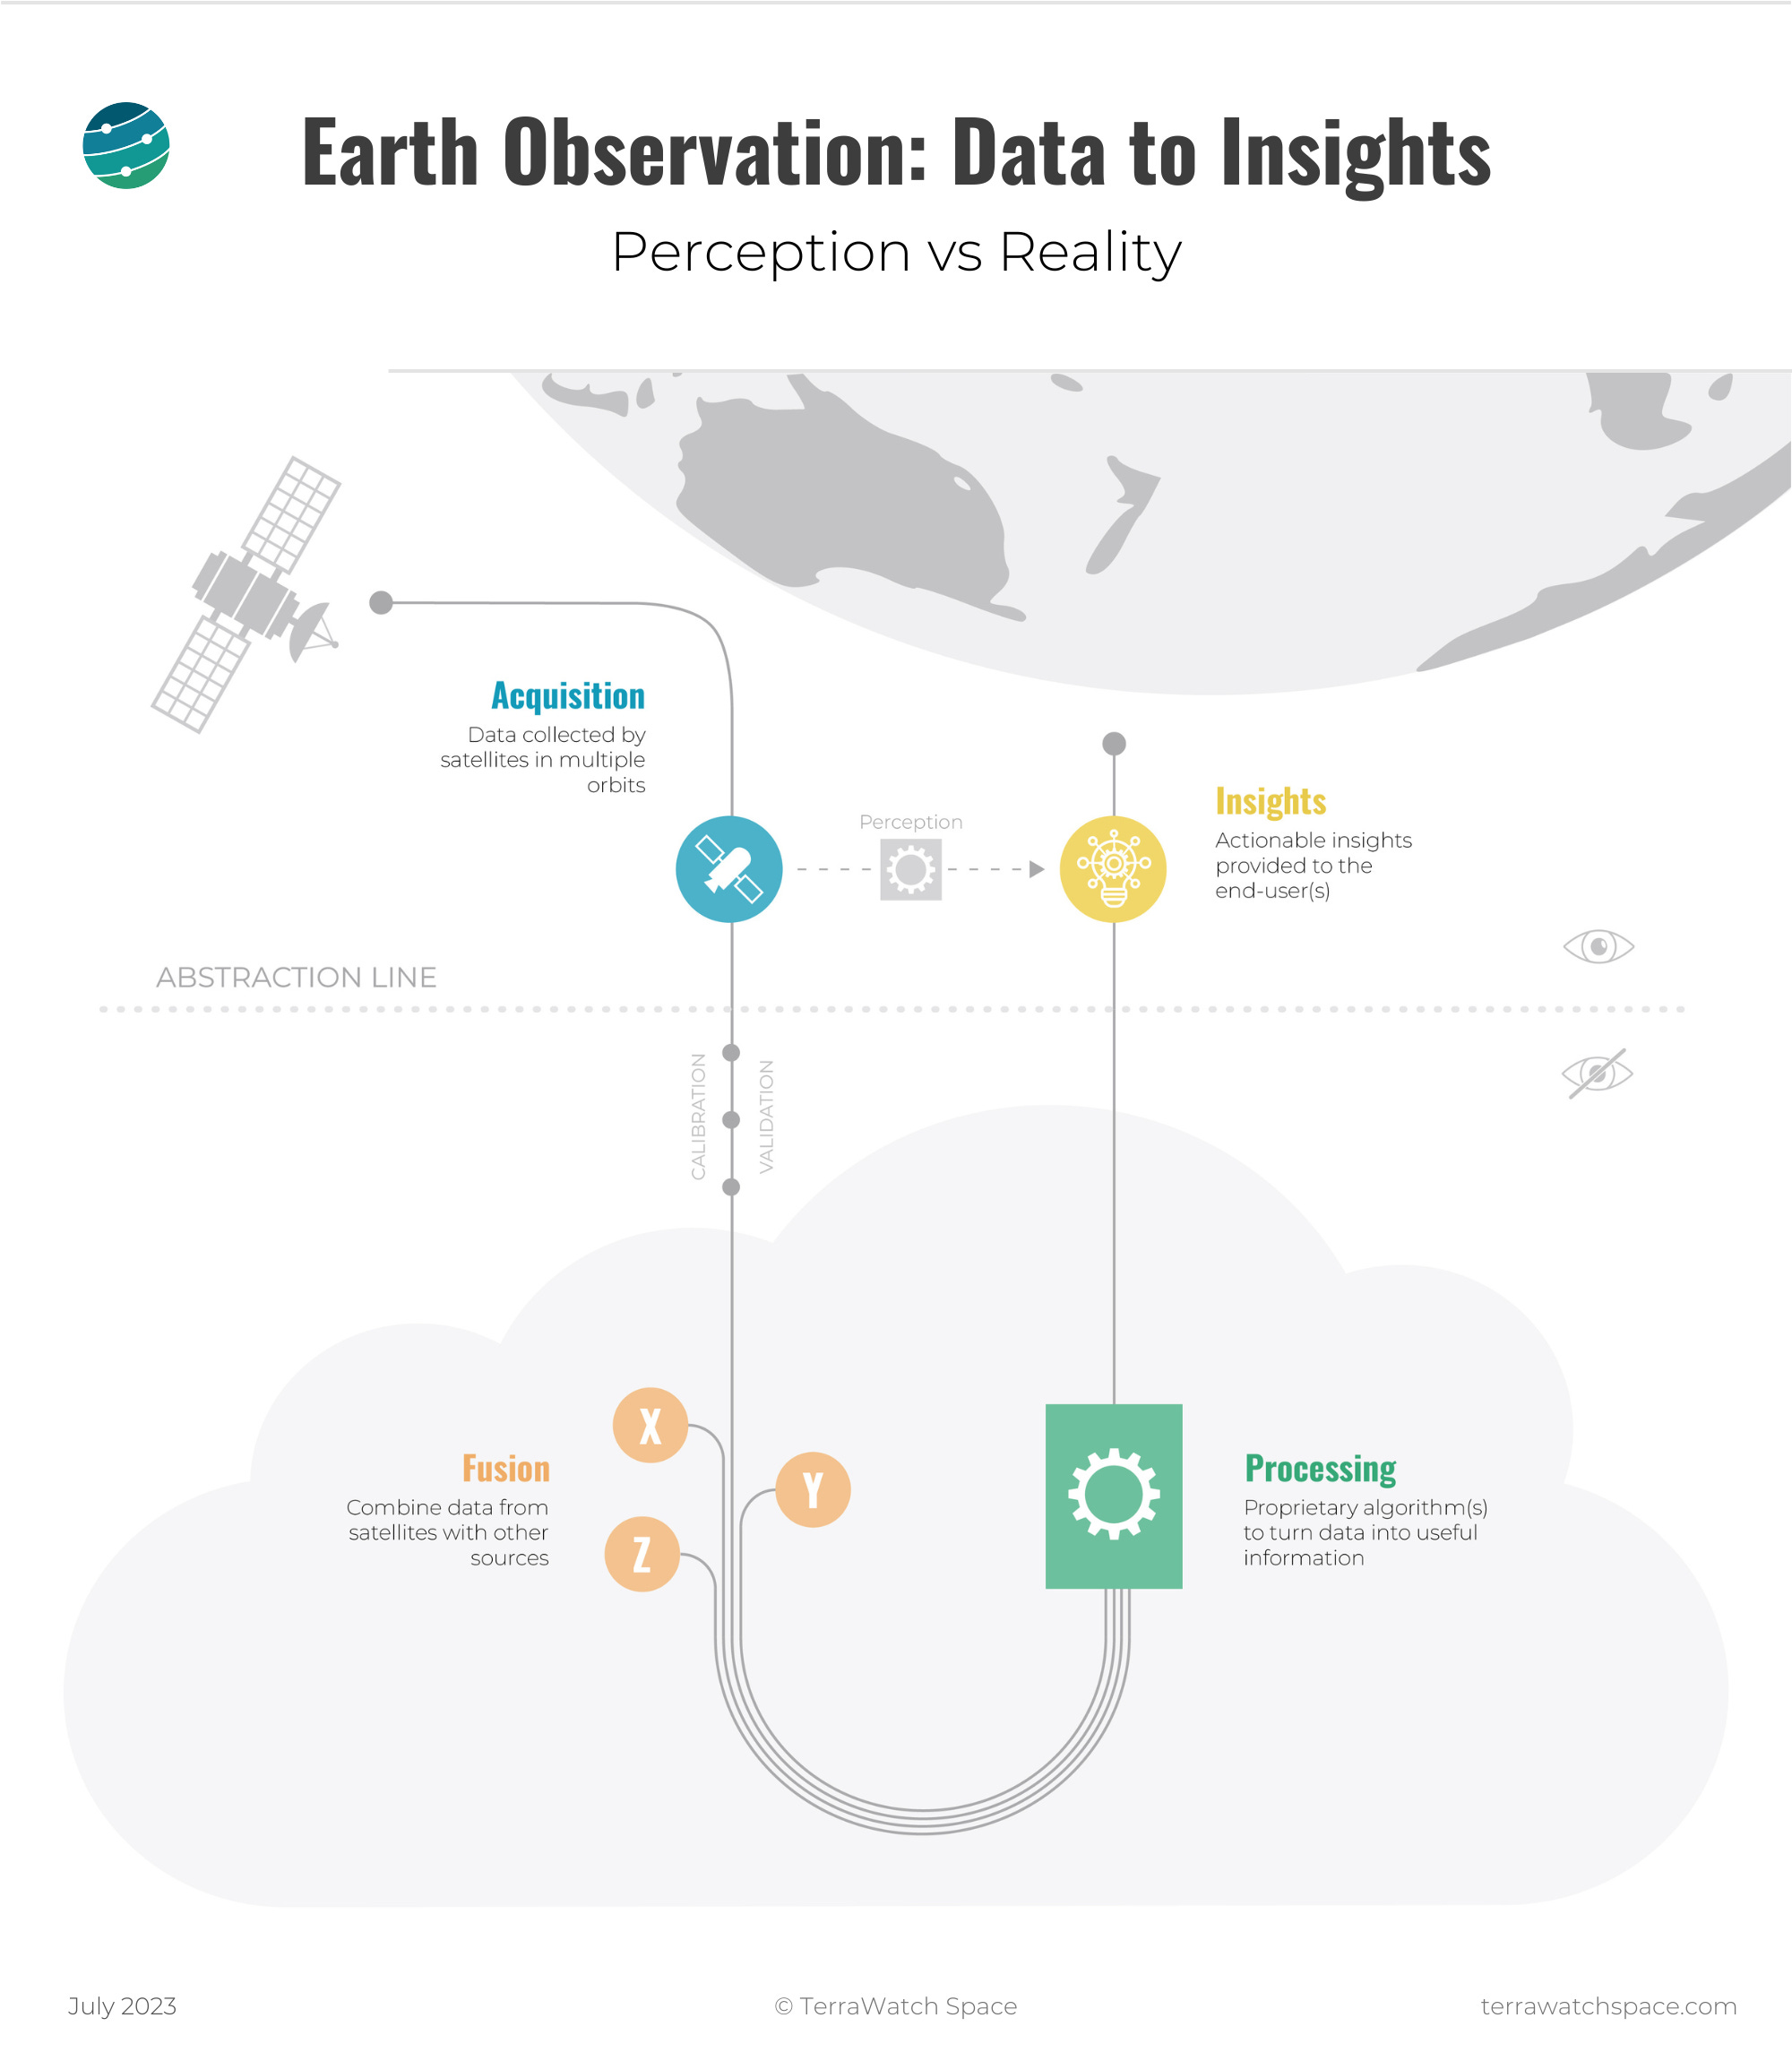
I noticed that there is generally a very limited understanding of the steps involved in the transformation of data derived from satellites into actionable insights. Granted not every user of an EO-based climate application needs to or will care about the whole process that goes on in the background, but a number of important, impactful decisions are being made with minimal awareness of the process of the translation of data from a satellite into a useful insight.
Some of these decisions are taken on an individual level (where to buy a property without worrying about floods or wildfires or other climate events?), some are taken on an enterprise level (what is the quantified risk of climate for our assets?), some on a national level (what is the level of threat of wildfire in a particular region?), and some on an international level (what is the amount of methane emissions released and what are the largest sources?).
For all of the questions above, there might be more than one answer possible, depending on each of those steps in the infographic above, given the infinite possibilities of methodologies, datasets and algorithms6. So, as much as we focus on the role of commercial EO in offering insights to solve a particular climate-related problem, it is equally, if not more, important to be able to fully understand how the insights were derived. Whether it is through continued peer-reviewed publications, complete transparency through an open-source model or simply letting the market decide, that remains to be seen. In any case, this is not the last time I will be writing about this subject.
Final Note
As always, my motivation - to write this piece, to put the infographics together and to publish this as an openly available resource - is derived from my vision to demystify EO and contribute towards making it mainstream. This is one of three deep dives I do every year, along with one on the state of EO (coming up in September) and the other on the state of weather from space (coming up in November).
I am grateful for all your encouragement, if you want to do more, here are some ways you can support my efforts. If you are an individual, you can upgrade to become a paid subscriber or support me on Patreon. If you are an organisation, you can sponsor the weekly newsletter or discuss ideas for sponsored content.
TerraWatch Space Insights is a reader-supported publication. To continue receiving new posts and support my work, consider becoming a free or paid subscriber.
Feel free to use the infographic with proper credits. And, if you have any thoughts or feedback, just hit reply. Cheers!
Until next time,
Aravind
Check out the last section in this piece for more on this but in essence, building solution to solve problems is very different from trying to solve problems with whatever we have built (this applies technically, scientifically and commercially). ↩
Verticalization is the strategy to focus on developing capabilities to solve a specific problem within a specific vertical as opposed to offering products for solving problems across use cases in several verticals. ↩
a) EO companies that do not have or showcase climate-related data, solutions or applications are not included;
b) Only those with a standard product offering with a focused go-to-market strategy for at least one of the climate applications mentioned are included;
c) Companies that are in their early stages, that have either not raised at least seed funding or have less than 10 employees are not included to keep the graphic less messy;
d) The upcoming deep dives on the use of EO across each of the climate applications will contain a more exhaustive pool of companies. So, stay tuned as you might find your organisation featured in those pieces.
e) And lastly, there are several organisations that do very important work in the area of EO for climate - as much as I want to, it would be impossible to fit all of them into one figure. Thanks for your understanding! ↩
For example, Iceye has been heavily verticalising into insurance & finance and Planet into agriculture & forestry (with the acquisitions of VanderSat and Salo Sciences). I expect this to continue across the EO industry, in which the only verticalisation strategy so far has been with defence & intelligence. ↩
Whether that is the most sustainable commercial strategy is still up for debate - my view is that those that have a very focused go-to-market strategy will tend to operate across many segments, while those that have a very generic go-to-market strategy will tend to operate across many segments. ↩
I am oversimplifying a little here, there are standards for data, methodologies and results set by intergovernmental organisations, space agencies, and non-profit entities, but I wanted to highlight this point as the exploding growth in the availability of commercial options means that there is potential for an infinite number of climate applications will be developed, derived from EO. So, I believe it is important to spread awareness of the “black-box challenge” in this domain. ↩


