

When I entered the Earth observation (EO) industry in 2017, market reports projected the global EO market would reach almost $10 billion by 2026. The expected growth was supposed to have been driven primarily by commercial adoption - agriculture, insurance, financial services, energy, mining etc. New EO satellite constellations were launching, venture capital was flowing in, enterprises were getting interested in EO. The trajectory seemed inevitable.
We are approaching 2026 now. Those same reports have quietly shifted their projections: $10 billion by 2035. A decade of expected growth, deferred.
Government and defense still represent approximately 75% of the EO market - roughly the same proportion as 2017, and not too different from what's expected in the coming years. Share from the commercial sector has grown only minimally, and is expected to maintain its slow growth.
Yes, the world looks different today. Countries around the world have significantly increased defense and intelligence spending over the past 3-5 years due to changing geopolitics.
But, I think defense spending obscures a more fundamental problem in the EO sector: we may have collectively misunderstood how commercial EO adoption actually works. Defense growth is real and reshaping the industry – I'll explore the defense dynamics and their implications for the industry in a (free to read) essay coming next week.
This deep-dive diagnoses why most commercial EO companies get trapped - either stuck in pilots or delivering bespoke projects - and shows some patterns I have seen companies use to break through.
Note: Whenever I talk about EO companies in this piece, it includes any company across the value chain - from those launching satellites and selling data to those building solutions that use EO (among other things) for solving a problem in any sector.
The commercial Earth observation (EO) industry has spent the better part of a decade accumulating pilots. Hundreds of proof-of-concepts, thousands of custom projects, countless announcements of partnerships. While successful operational deployments and repeatable products exist, they remain the exception. Much of the industry's revenue comes from custom project work that never productizes.
The standard explanation blames technology limitations, data costs, or user sophistication. But the satellites work. Open data like Sentinel and Landsat exists, cloud platforms have eliminated infrastructure barriers. Yet most commercial EO companies remain stuck - either in pilots or delivering bespoke projects.
I think the real barrier is structural: we have been using the wrong mental models to understand how EO gets adopted. Frameworks borrowed from SaaS and enterprise software assume linear progression from pilot to production. They did not account for how a horizontal infrastructure like EO actually becomes operational.
The Invisibility Curve attempts to offer a different model. It explains why most initiatives get trapped in endless pilots and projects, why successful adoption happens quietly when it does occur, and why the companies generating the most attention rarely achieve sustainable scale. More importantly, it reveals the structural forks that separate companies that escape from those that remain stuck.
This framework comes from years of advising 50+ enterprises including Fortune 500 firms across sectors on EO adoption strategy, and working with dozens of EO companies on go-to-market strategy, product development, and business models. The patterns described here emerge from observing what actually works and what fails - not from theory, but from repeated outcomes across organizations.
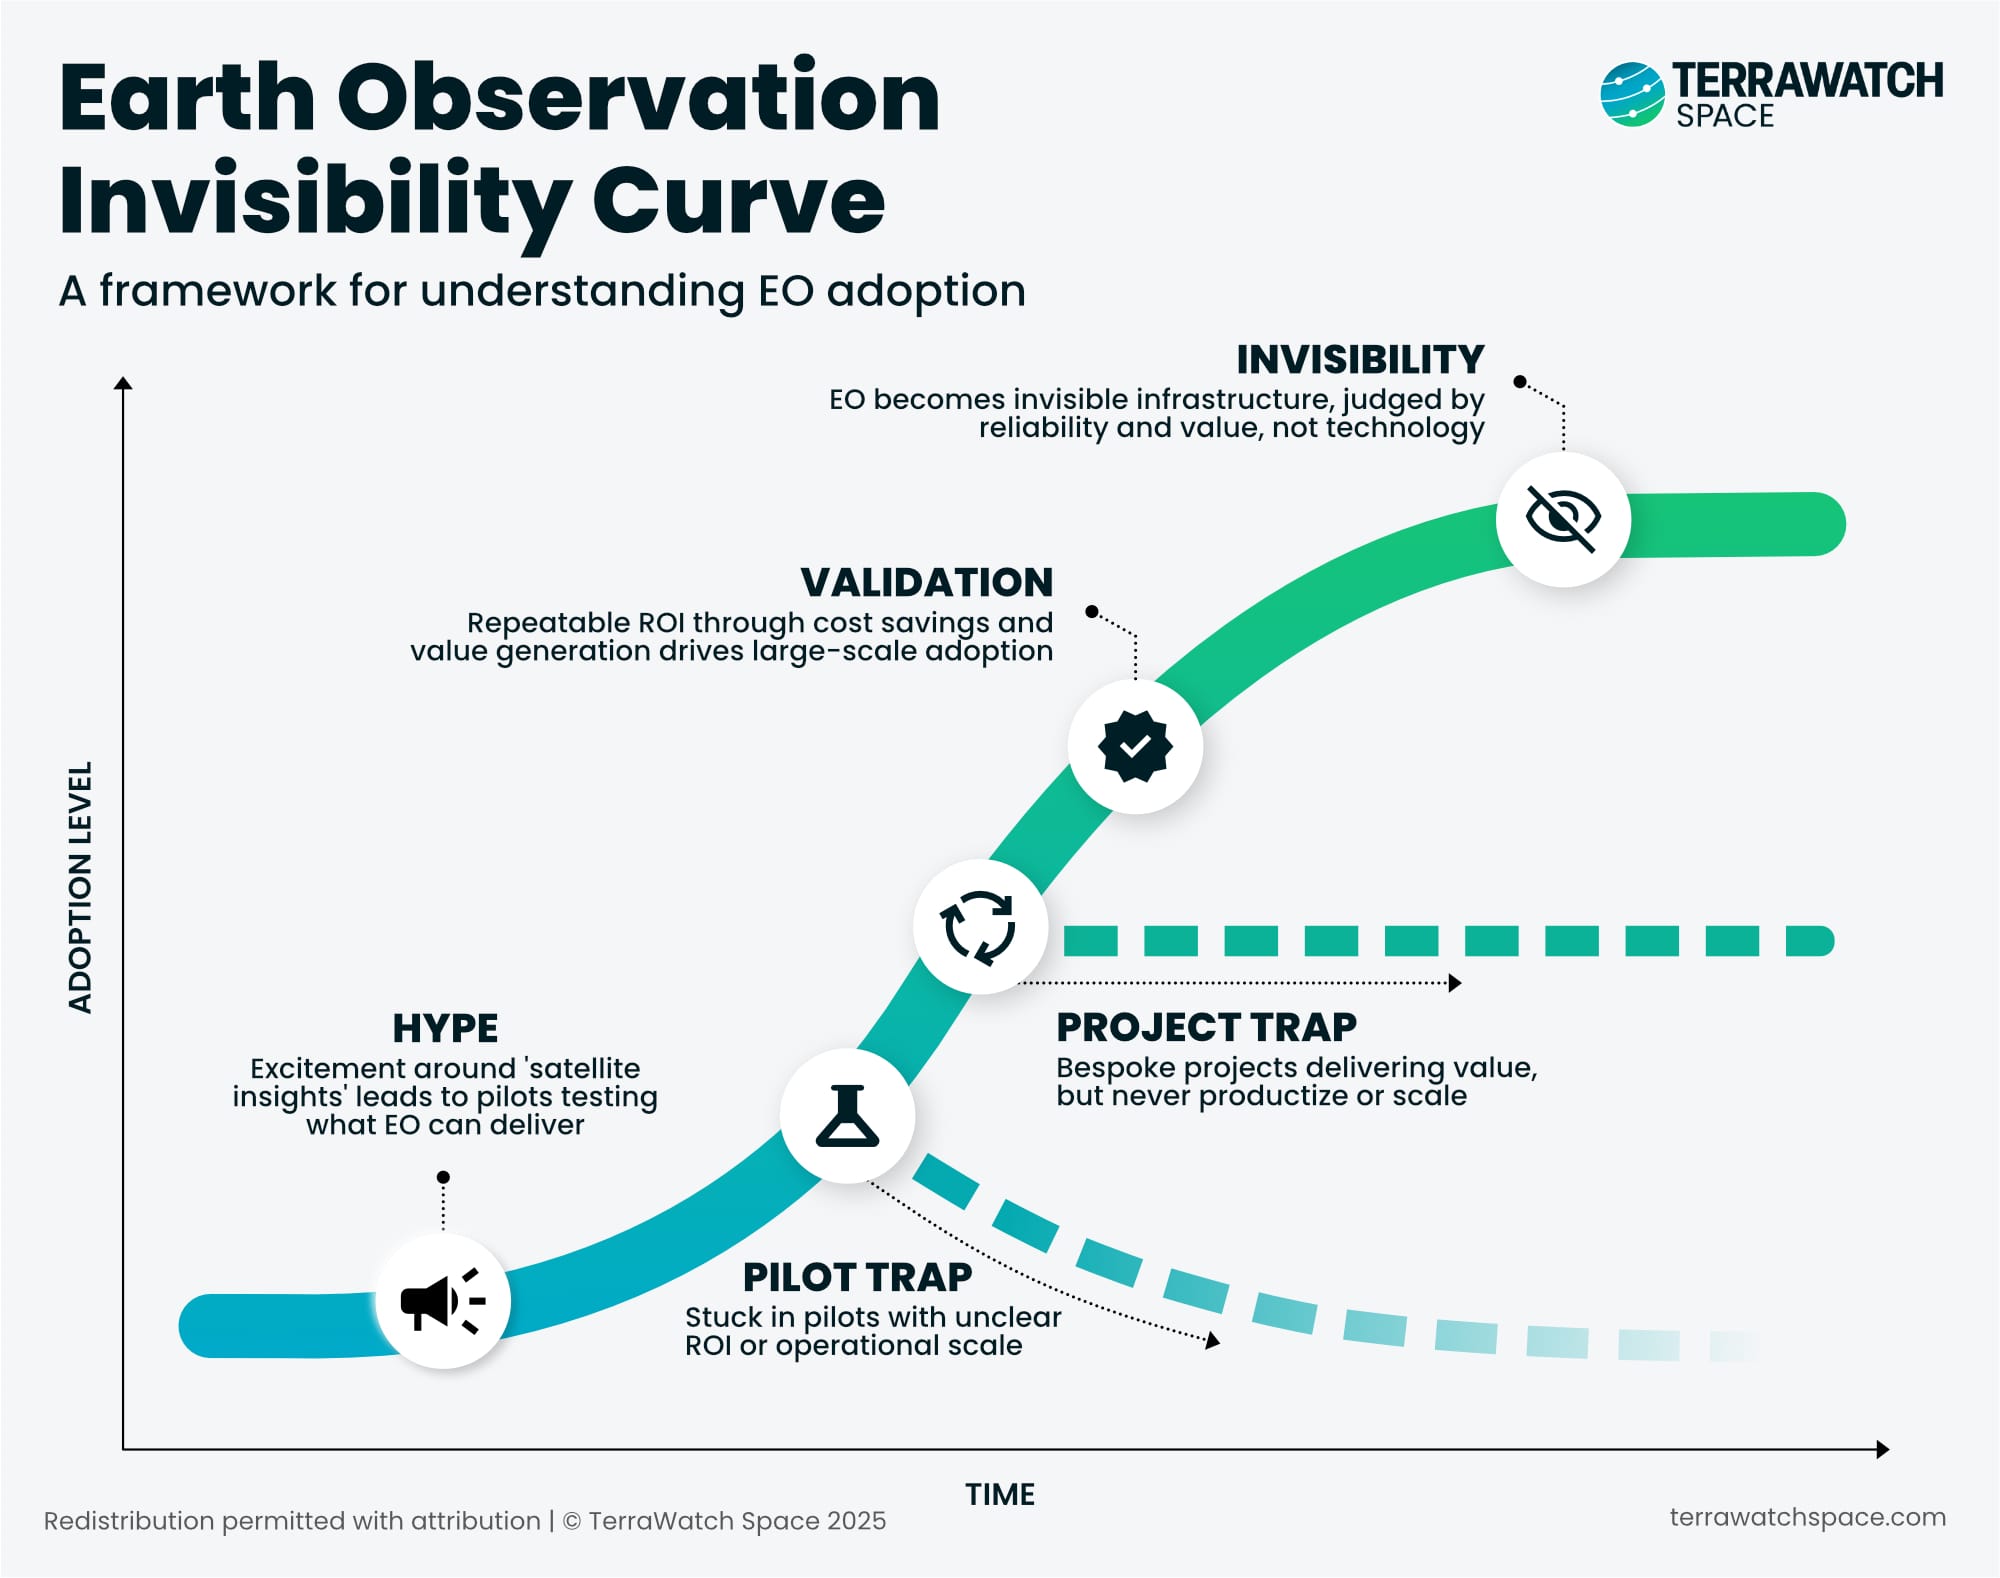
The EO Invisibility Curve
"EO does not win when it is visible, it wins when it disappears."
The curve tracks five stages: Hype, Pilot Trap, Project Trap, Validation, and Invisibility. The X-axis represents time; the Y-axis represents the level of adoption and productization - not revenue, not pilot count, but actual repeatable integration into how organizations make decisions.
What makes this different from standard technology adoption frameworks like the Gartner Hype Cycle or Geoffrey Moore's Crossing the Chasm is the recognition of two failure modes, not one. Most models acknowledge that adoption is hard. The Invisibility Curve reveals something more specific: companies face two sequential divergence points. The first fork separates pilots from deployment. The second fork separates bespoke projects from repeatable products. Most companies get trapped at one of these forks.
The single biggest mistake the EO industry keeps making is assuming adoption is a linear function of technical capability - it is not. Adoption is a function of , workflow integration, budget ownership, ground truth availability, and repeatability. Sensors improve every year; these structural dynamics barely move. The Invisibility Curve exists because technology isn’t the bottleneck — the market structure is.
The forks are not bugs in the model. They are the central features, and in my opinion, the explanation for why EO hasn't scaled despite obvious demand and perhaps, why the industry collectively keeps missing its growth projections (for the commercial segment).
The Five Stages
- Hype: Storytelling Over Need
The Hype stage is where most EO journeys begin. Executives read about satellite data in publications. Board members ask about space-based capabilities. Innovation teams get budget to explore "what EO can do for us."
The attraction is narrative-driven rather than problem-driven. EO sounds forward-thinking and technologically sophisticated. It generates favorable press releases. It signals that an organization is innovating, looking ahead, leveraging cutting-edge capabilities. The technology itself becomes the story.
These early pilots are designed around curiosity rather than solving specific problems.
The pilots are based on "what can we see with satellites?" instead of "what decision would change if we had this information, and how would we integrate it into our existing processes?"
This framing almost guarantees they will produce interesting insights without much operational impact. So, this phase is not inherently problematic - it is how most new technologies enter large organizations. Innovation teams are supposed to explore possibilities.
The problem emerges in what comes next, and how many initiatives never move beyond this exploratory stance.
- Pilot Trap: The Terminal State
The Pilot Trap represents the default state in EO - endless iteration without operational deployment. Most EO companies in this stage don't fail dramatically - they persist as pilots indefinitely, consuming budget and generating slide decks but never becoming operational.
The reasons, as we will explore in detail later, are structural, not technical. Some examples below:
- No Workflow Integration: EO outputs arrive as PDFs or standalone dashboards. They don't feed into ERP systems, asset management tools, or claims processing workflows. When users must leave their normal processes to access insights, they won't do it consistently.
- Unclear ROI attribution: Most EO pilots I have seen rarely establish mechanisms to track specific decisions or measure outcomes. Without clear attribution, procurement for an EO-based solution are based on faith rather than demonstrated value.
The Pilot Trap is not a transition phase, but most EO companies never escape it.
The pattern above repeats across sectors. Companies accumulate pilots while believing they are making progress. When leadership changes or budgets tighten, everything evaporates because nothing was operationally embedded.
- Project Trap: Operational But Not Scalable
Some companies escape the Pilot Trap and reach operational usage, but get stuck in a different pattern. They deliver real value solving actual problems, with committed budgets and satisfied customers. But every engagement remains bespoke.
The Project Trap looks like success on the surface. Projects address real problems - post-disaster damage assessment, quarterly asset monitoring, seasonal crop forecasting, site-specific risk analysis. The work is legitimate and valued.
But nothing productizes. Each engagement starts from scratch: custom scoping, tailored analysis, one-off delivery. An algorithm that works in Location A gets rebuilt for Location B. A workflow developed for Customer 1 doesn't transfer to Customer 2. The company accumulates project revenue without building repeatable capabilities.
A few reasons why companies stay trapped here:
- Project revenue feels comfortable. Bespoke work commands premium pricing. Customers pay well for custom analysis. There is always another project in the pipeline. Revenue growth looks steady without the risk of productization.
- Technical challenges seem insurmountable: Algorithms don't transfer across geographies. Data availability varies by region. Customer needs differ substantially. Building something repeatable feels harder than delivering another custom project.
- No forcing function: Projects that deliver value just continue indefinitely. Unlike pilots that eventually face scrutiny about whether to continue. There is no pressure to standardize or productize when customers keep paying for custom work.
The Project Trap is not about lack of value delivery, it is about building a services business instead of a scalable product.
The companies stuck here serve 20 customers with 20 different implementations. Revenue per customer stays flat. Margins compress as complexity grows. They can't hire specialized teams or build vertical expertise because every project is different. They are operationally successful but structurally capped.
Note: To be clear, there is nothing wrong with running a profitable services business, unless you raised venture capital promising software margins. The 'trap' here is not the revenue itself, but the structural misalignment between your business model (linear, labor-intensive services) and your capital structure (which demands exponential, product-led scale).
Validation: The Inflection Point
Validation happens when EO crosses two thresholds: from discovery to operational deployment (escaping the Pilot Trap) and from bespoke projects to repeatable products (escaping the Project Trap).
This is the true inflection point - not just using EO operationally, but operational usage that can scale. The main indicators of this phase are:
- Integration with core systems: EO outputs flow into ERP, transportation management platforms, asset management systems, claims processing. Users access insights without leaving their daily tools.
- Daily or weekly usage, not quarterly reviews: Teams reference EO-derived metrics in operational meetings the same way they reference sales figures or inventory levels.
- Organic adoption: The question shifts from "does this work?" to "where else should we deploy?" This expansion signals value demonstrated through usage, not evangelism.
Validation separates companies that accumulate activity from those that compound value.
Validation is where repeatable ROI gets demonstrated through measurable cost savings and value creation. Insurance companies reduce payouts. Utilities prevent outages. The value is measured, attributed, and operationally integrated.
Invisibility: The End State
Invisibility represents the moment when EO stops being marketed as a distinct capability and starts being assumed as basic infrastructure. End users don't know or care that satellites provide the underlying data. They only care that the system delivers reliable outputs. The main characteristics of invisibility are:
- EO disappears into integrated systems: EO gets procured as part of integrated systems - asset management platforms, supply chain solutions, risk services - not as satellite data. Organizations buy outcomes, not data sources. Competition shifts to API reliability, support quality, and integration depth. Pure-play EO providers often lose to systems integrators who embed EO invisibly into complete solutions
- Pricing shifts from "per sq.km" to "per outcome delivered": Instead of paying for imagery coverage or analysis hours, customers pay for predictions, automated alerts, or decision support. A shipping company pays for "vessel location confidence" not "AIS combined with optical and SAR imagery fusion." An insurer pays for "flood risk scoring" not "SAR-derived water extent mapping." The pricing reflects value delivered, not data consumed.
- Service level agreements matter more than spatial resolution. Technical conversations shift from "how many spectral bands does your sensor have?" to "what's your guaranteed uptime percentage and incident response time?" Customers evaluate vendors based on operational reliability and service delivery, not sensor specifications or constellation size.
When EO becomes invisible, the industry finally stops being 'the EO industry' and starts being foundational infrastructure.
Ultimately, Invisibility represents a fundamental identity shift. At this stage, you effectively cease to be an 'EO company' and become a 'InsurTech' or 'AgTech' or 'InfraTech' solution provider. The satellite data moves from being the product you sell to simply being the backend engine that powers the competitive advantage.
This invisibility phase is where EO becomes genuine infrastructure - comparable to GPS or cloud computing. But, it is not about EO being ignored or marginalized. It is about being assumed, so essential to operations that questioning whether to use it would seem absurd.
Maritime vessel tracking is approaching invisibility in commodity trading and shipping logistics - it is becoming routine supply chain infrastructure where the satellite data layer has disappeared from user consciousness.
The rest of the essay continues with:
- The Fork: Two Divergence Points
- The First Divergence: The Pilot Trap
- The Second Divergence: The Project Trap
- How to Make the Transitions
- Escaping the Traps: What Tends to Work
- Escaping the Pilot Trap: From Discovery to Deployment
- Escaping the Project Trap: From Exploration to Exploitation
- What This Means for the Next Five Years
- Verticalization, AI, Consolidation, Role of Governments and How to Differentiate
- How to Use This Framework
- Conclusion


