

To the premium subscribers, thank you for your support - it allows me to write these deep-dive briefings and continue to provide the weekly newsletter for free.
To the free subscribers, this is a short preview. If you would like to read this and more deep dives, please upgrade your subscription.
In this deep dive, we unpack the key investment trends shaping the Earth observation (EO) sector in the first half of 2025, breaking down funding activity by segment, region, growth stage, and year-over-year comparisons.
Beyond funding, we also review notable developments across the EO landscape, including M&A activity, the launch of national constellations, and major commercial and government contracts. Finally, we look ahead to H2 2025, outlining the dynamics that could shape the next half of the year.
A few disclaimers before we get into the analysis:
- The funding figures are based only on venture capital and private funding rounds - grants and other public procurement contracts are mentioned separately where relevant, but are not included in the totals.
- While we touch on the performance of publicly traded EO companies ($PL, $BKSY, $SPIR, $SATL), it’s only at a high level to contextualize the private fundraising landscape.
- The analysis is limited to the EO sector, it does not include anything related to the broader space industry (see the EO value chain below for details).
Here is what we have in store for this briefing:
- The TerraWatch EO Value Chain
- EO Investments in H1 2025
- By Segment
- EO Investments: H1 2025 vs 2024 vs 2023
- By Region
- Major EO Developments in H1 2025
- M&A and Consolidation
- Public Market Snapshot
- Major Contracts & Announcements
- What to Expect in H2 2025
The TerraWatch EO Value Chain
Before diving into the analysis, here’s a quick recap of how we define the EO value chain at TerraWatch. While this continues to evolve, as the market evolves, this framework underpins the segmentation used throughout this review (and everything else you will see from us).
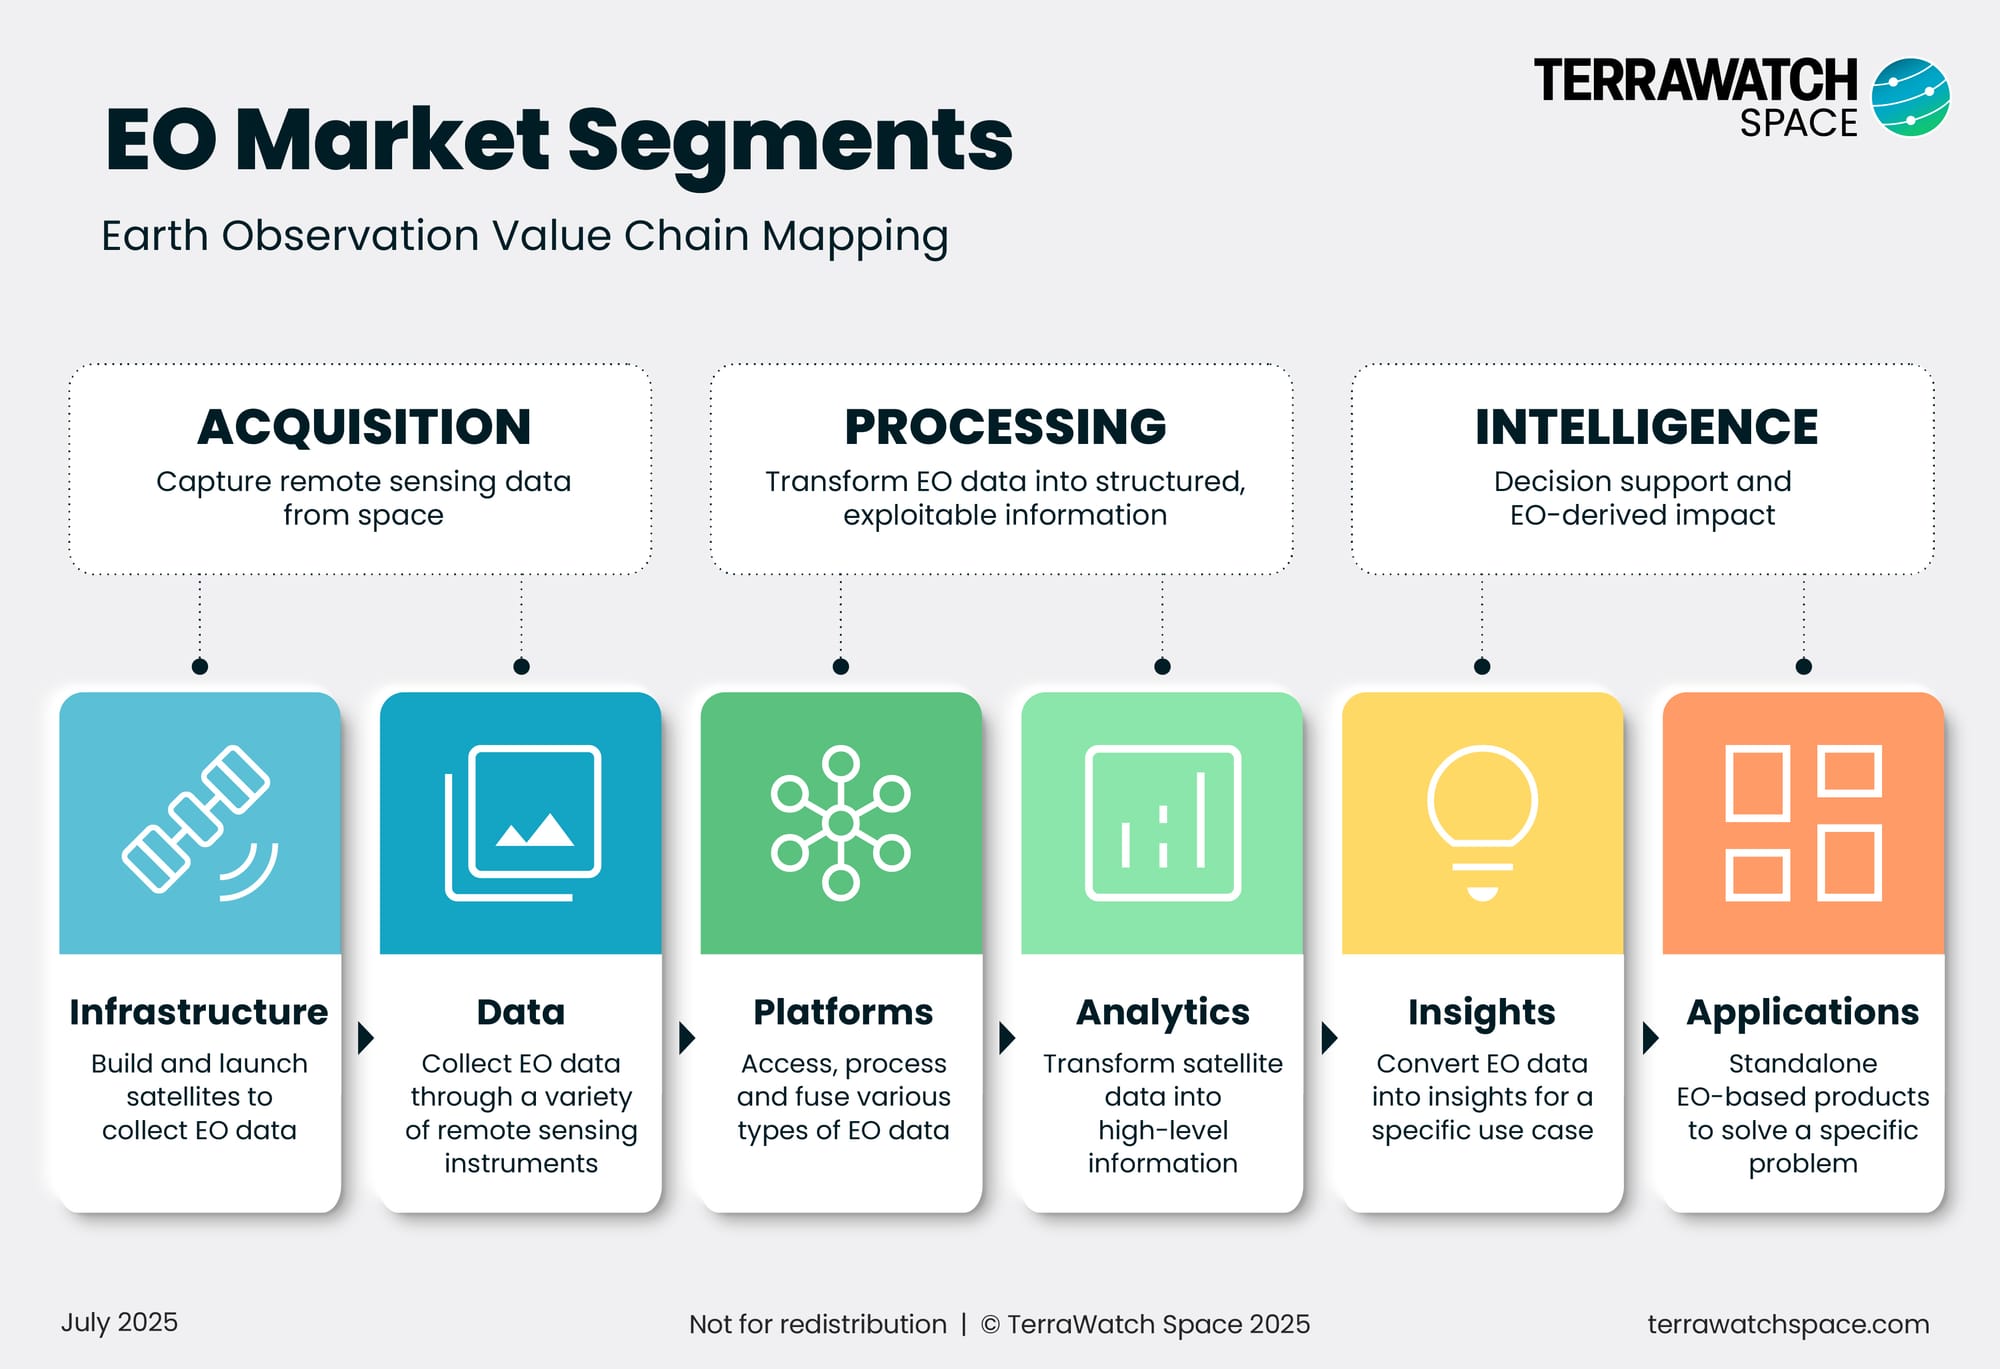
The EO value chain is structured across three broad stages: Acquisition, Processing, and Intelligence, which are further broken down into six core segments, as described below.
To bring this value chain to life, I have included a wildfire monitoring example that follows how EO data flows from satellite to application.
- Infrastructure: Includes companies that build the satellites predominantly meant to launch EO instruments.
Example: A satellite equipped with a thermal infrared sensor is launched specifically to monitor wildfires.
- Data: Refers to the collection and delivery of EO data from satellites through various remote sensing instruments.
Example: An EO provider delivers wildfire imagery (e.g., 30m resolution, twice daily) under a subscription or per-scene model.
- Platforms: Platforms allow users to access, process, and integrate EO data from multiple sources via APIs and preprocessing workflows.
Example: An EO expert uses a geospatial platform to fuse datasets and run standard workflows for wildfire risk analysis.
- Analytics: This segment transforms raw satellite data into structured, high-level information.
Example: An EO expert derives key wildfire indicators such as vegetation growth, soil moisture, and surface temperature, from EO data.
- Insights: Involves converting EO data into useful insights by aggregating and interpreting the previously derived analytics to support specific decisions.
Example: A wildfire mitigation specialist at a utility firm models fire progression using EO-derived indicators, provides 3-day forecasts on a dashboard, and triggers early warning alerts to operations teams.
- Applications: Standalone tools that use EO among other sources of data to solve concrete problems in a specific domain.
Example: A wildfire management platform that triggers grid shutdowns, firefighter deployment, or insurance workflows based on EO alerts.
EO Investments in H1 2025
By Segment
The total investments in EO over H1 2025 are estimated to be $600M, with Acquisition and Intelligence segments contributing to almost 3/4th of all the funding raised.
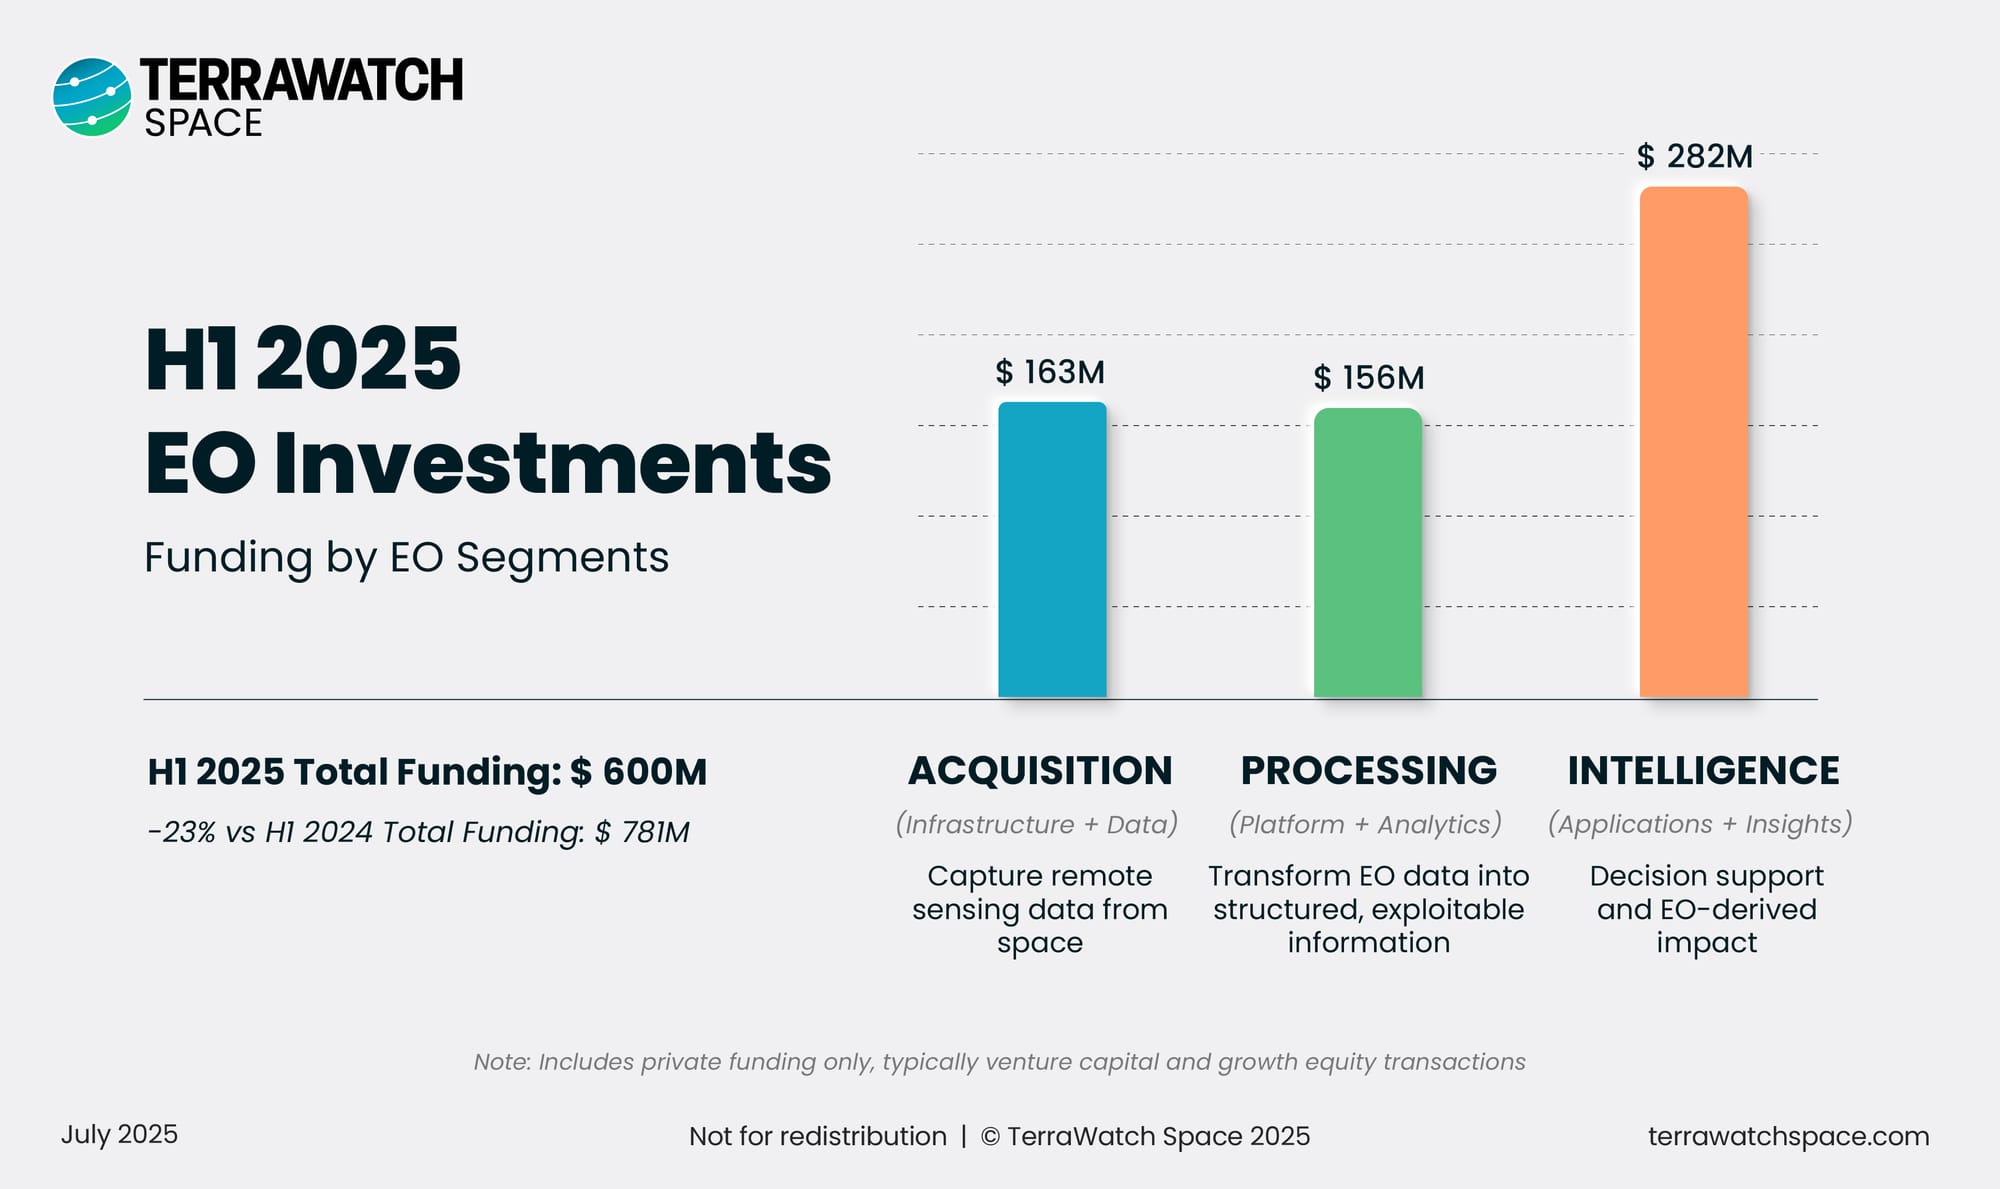
Companies in the Acquisition layer had a sluggish first half of the year, raising a total of around $163M, well below previous years in terms of volume. The largest rounds came from Muon Space ($44.5M), Urban Sky ($30M), and Insight M ($30M). Despite the lower total funding, the number of deals remained relatively high, with activity distributed across Europe, the Middle East, and Asia-Pacific.
Companies in the Processing layer, which normally gets very little funding, as I wrote in the EO Platform deep-dive, are seeing a quiet revival, largely fuelled by the AI wave. Of the $156M raised in this segment during H1 2025, the vast majority came from Xoople, a Spanish startup that emerged from stealth with a $129M raise, announcing strategic partnerships with Esri and Microsoft.
Companies in the Intelligence segment saw a muted first half of the year, especially compared to the strong momentum of previous years. Total funding in H1 2025 reached $282M, reflecting broader softness in climate tech investment. The top 3 largest rounds in this segment included Pano AI ($44M), BeZero ($32M), and Treefera ($30M).
Note: Helsing’s €600M round, one of the largest in European defense tech, is not included in the EO funding totals shown above. While Helsing is working with Loft Orbital to launch EO satellites as part of its broader defense strategy, its core offering is a multi-domain defense system spanning land, air, sea, space, and cyber.
Including this round in an EO investment analysis might exaggerate the role of EO in Helsing's business and distort the overall figure, especially the Applications layer. With that said, the strategic use of EO here is certainly worth noting, especially as it becomes a part of multimodal solutions.


