

Welcome to another edition of ‘Last Week in Earth Observation’, containing a summary of major developments in EO from last week and some exclusive analysis and insights from TerraWatch.
In this edition: More emissions seen by satellites, finding bitcoin mines from space, strategic dilemmas in the EO market and more.
PS. This is the last edition of this weekly newsletter for this year. We will be back in a couple of weeks after the Christmas break. Happy holidays!
Four Curated Things
Major developments in EO from the past week
1. Contractual Stuff: Funding, Contracts and Deals 💰
Funding
- Japanese SAR satellite startup iQPS, which launched added another satellite to its constellation via Rocket Lab last week, has raised $27 million in its initial public offering on the Tokyo stock market;
- BirdsEyeView, an insurtech startup that leverages EO data for its natural catastrophe product has raised an undisclosed seven-figure sum;
- McKenzie Intelligence Services, an EO solution provider for the insurance industry, has secured a strategic investment from private equity firm Maven;
Contracts
- Weather satellite manufacturer Orbital Micro Systems won a $1.7M contract from the US Space Force to develop passive microwave payloads;
- Spire was awarded a multi-million euro contract by EUMETSAT, Europe’s meteorological satellite agency to provide RO data for the next two years;
2. Strategic Stuff: Partnerships and Announcements 📈
M&A
Reinsurance company Swiss Re has acquired UK-based Fathom, a flood risk analytics provider that leverages several sources of EO data;
Fathom was featured on this episode of the TerraWatch Space podcast.
Following the acquisition of Sinergise, Planet has added its analytic feed, Planetary Variables, to the Sentinel Hub platform;
My take: This is a pretty exciting move that could make EO data more usable as users now have the capacity to acquire ready-to-use analytics as well as build analytics independently, both via the same Sentinel Hub platform.
Announcements
The first satellite from UK-based EO startup, SatVu, equipped with a thermal infrared sensor, has suffered a failure in orbit, due to a camera malfunction;
The US Space Force will launch a new market research study to assess the state of commercial weather services to fill some of the military’s data needs;
Want to learn more about the commercial landscape of weather from space? Check out this free-to-access, deep-dive from TerraWatch.
3. Interesting Stuff: More News 🗞️
- Indian space agency ISRO has enabled access to an extensive archive of EOdata from 44 satellites, including Indian and foreign remote sensing sensors acquired since 1986;
- ESA is delaying the final flight of the Vega rocket because of a problem with the rocket’s upper stage, and is switching the payloads it will launch - the long-awaited Sentinel-1C instead of the Biomass satellite;
- A couple of recently launched NASA EO missions - SWOT (water monitoring) and TEMPO (air pollution) - are performing exceptionally well.
4. Click-Worthy Stuff: Check These Out 🔗
This piece that discusses how ESA’s Cryosat mission was used to measure the thickness of the iceberg and what it means;
This article (written by me) from over a year ago on the top five trends in EO.
If you are wondering which of those trends hold in 2023 and what the new ones are, stay tuned for the “This Year in EO” edition.
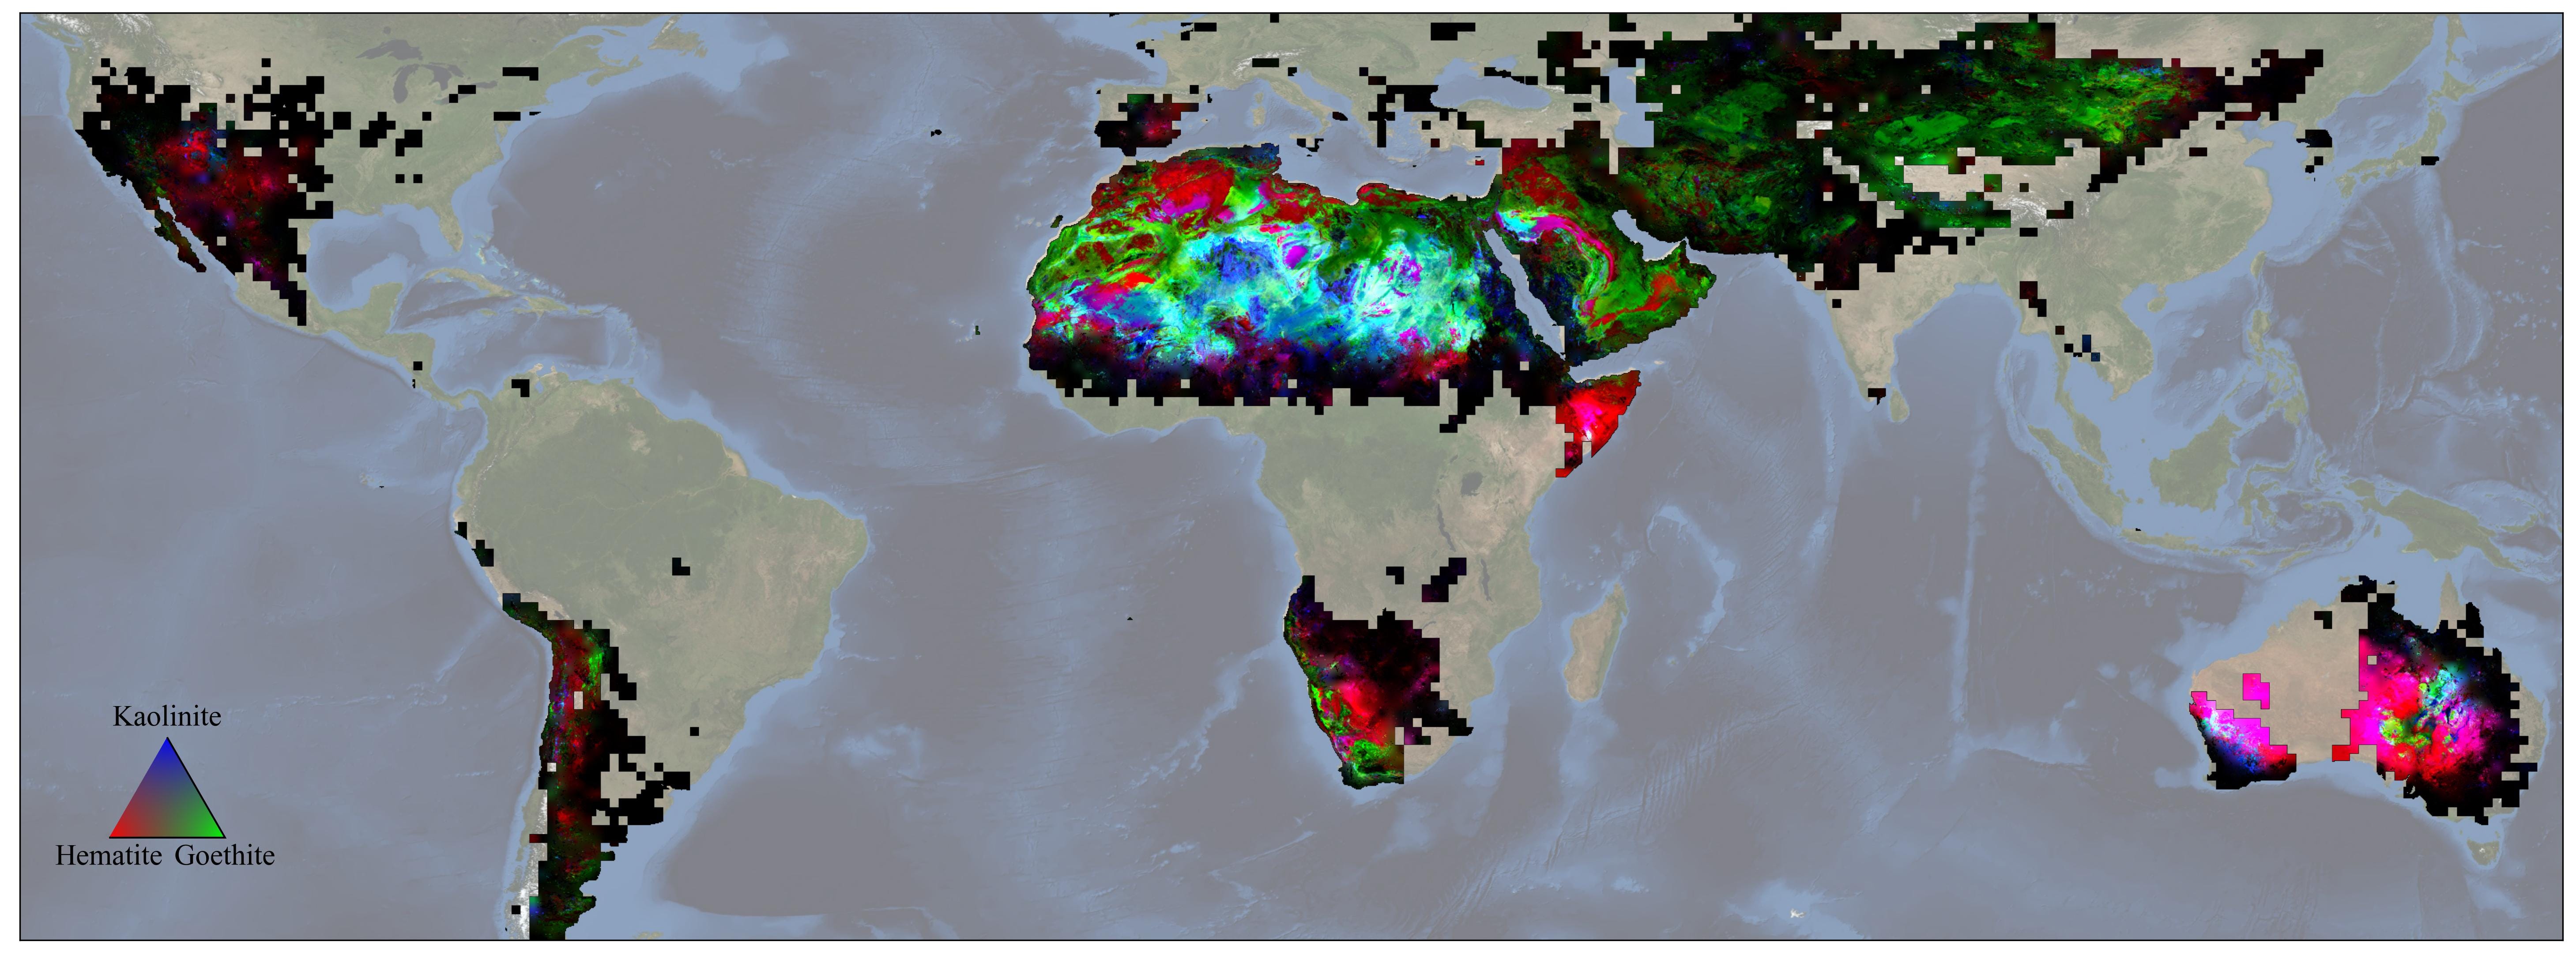
This article that discusses how NASA’s EMIT sensor provided data to map the world’s mineral dust-source regions, providing precise locations of 10 key minerals based on how they reflect and absorb light;
Spotlight: EO Summit
The website for EO Summit is live. Early bird ticket sales will be starting the first week of January.
Call for EO companies: If you want to showcase what you have to offer in front of the audience that matter (aka end-users), then consider becoming a sponsor for EO Summit. Here is the sponsorship brochure!

If you enjoy this newsletter, please subscribe. Already a subscriber? Then, please consider upgrading to support the effort.
One EO Discussion Point
Exclusive analysis and insights from TerraWatch
5. The Future of EO - in the Foreground, Middle Ground or in the Background?
I have been thinking of how the EO sector continues to emphasise satellites while it communicates to the outside world, as we look for more adoption of EO in the attempt to go mainstream.
If you have read my previous posts, you might know I like to simplify (or oversimplify) things, by introducing some random terminology. I have done that again, and in this case, for defining different approaches that the EO sector is taking to become that multi-billion dollar commercial market - to be in the foreground, in the background or find and settle on a middle ground.
The figure below summarises almost everything I have to say.
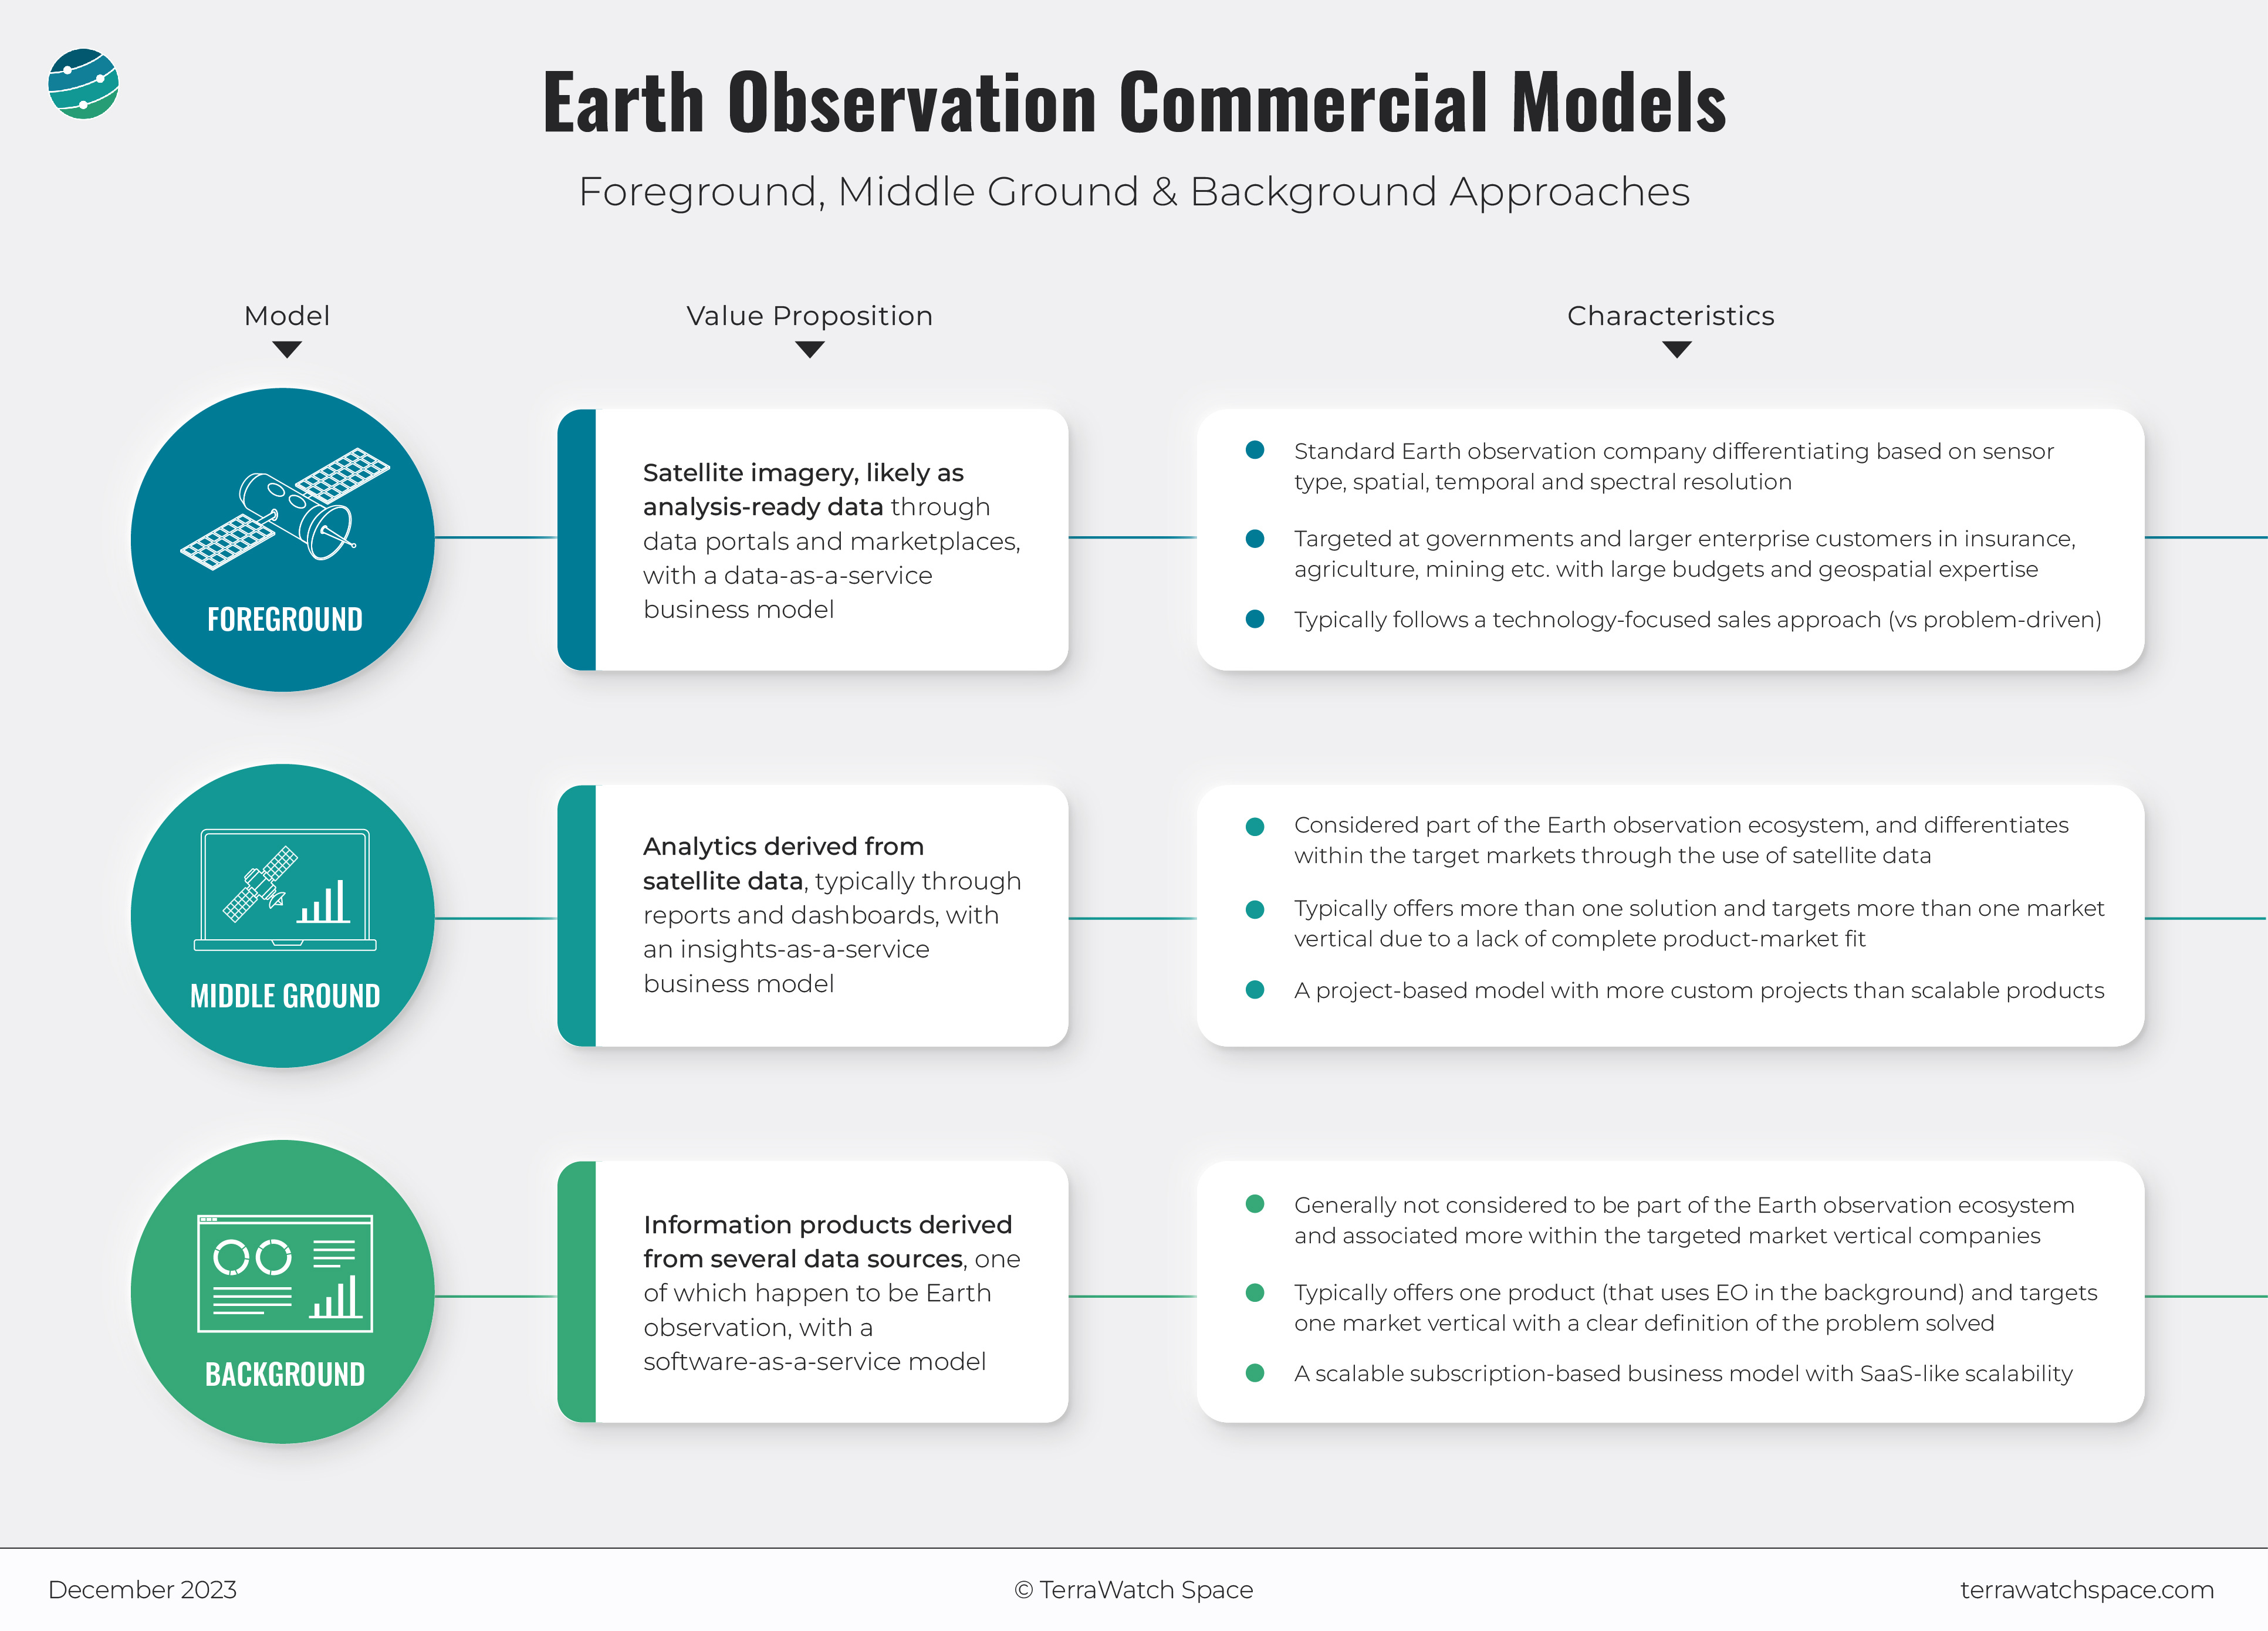
The EO in the Foreground Model
Not many folks within the larger tech industry (i.e. outside the EO community) understand remote sensing or have used geospatial data before. Convincing them to buy more EO data is probably the path to the multi-billion dollar market. But, apart from some anchor customers who already understand the value of EO data, have strong competencies in processing it and know how to integrate it into their workflow, I am not particularly very bullish on this approach in the short term.
The Middle Ground Model
There is a caveat to growth through the middle ground approach. The larger enterprises within the specific market verticals (insurance, agriculture, financial services etc.) might decide to form their own internal EO data processing teams to build their own set of tools that perfectly respond to their needs, thereby eliminating the need for a middle ground approach. I don’t expect this to happen anytime soon as the end-users are probably still in the discovery phase of understanding what the strategic value of EO is for their businesses. Once the product-market fit is established, we might see more consolidation here, with the successful EO downstream companies being acquired by the big corporations of our time.
The EO in the Background Model
I may have changed my mind about quite a few things ever since I started working in EO, but I have always stuck to this fact:
EO data is just another type of data that we use to build software products.
End-users, be it a consumer using a mobile application or an employee in a major corporation using an enterprise software application, do not care how they get their answers, they just want to get their “job done”.
So, this approach is what I am betting on in the long term - to consider EO data as just another source of data to build a product with, thereby making the product the selling point rather than the underlying technology itself.
Scene from Space
One visual leveraging EO
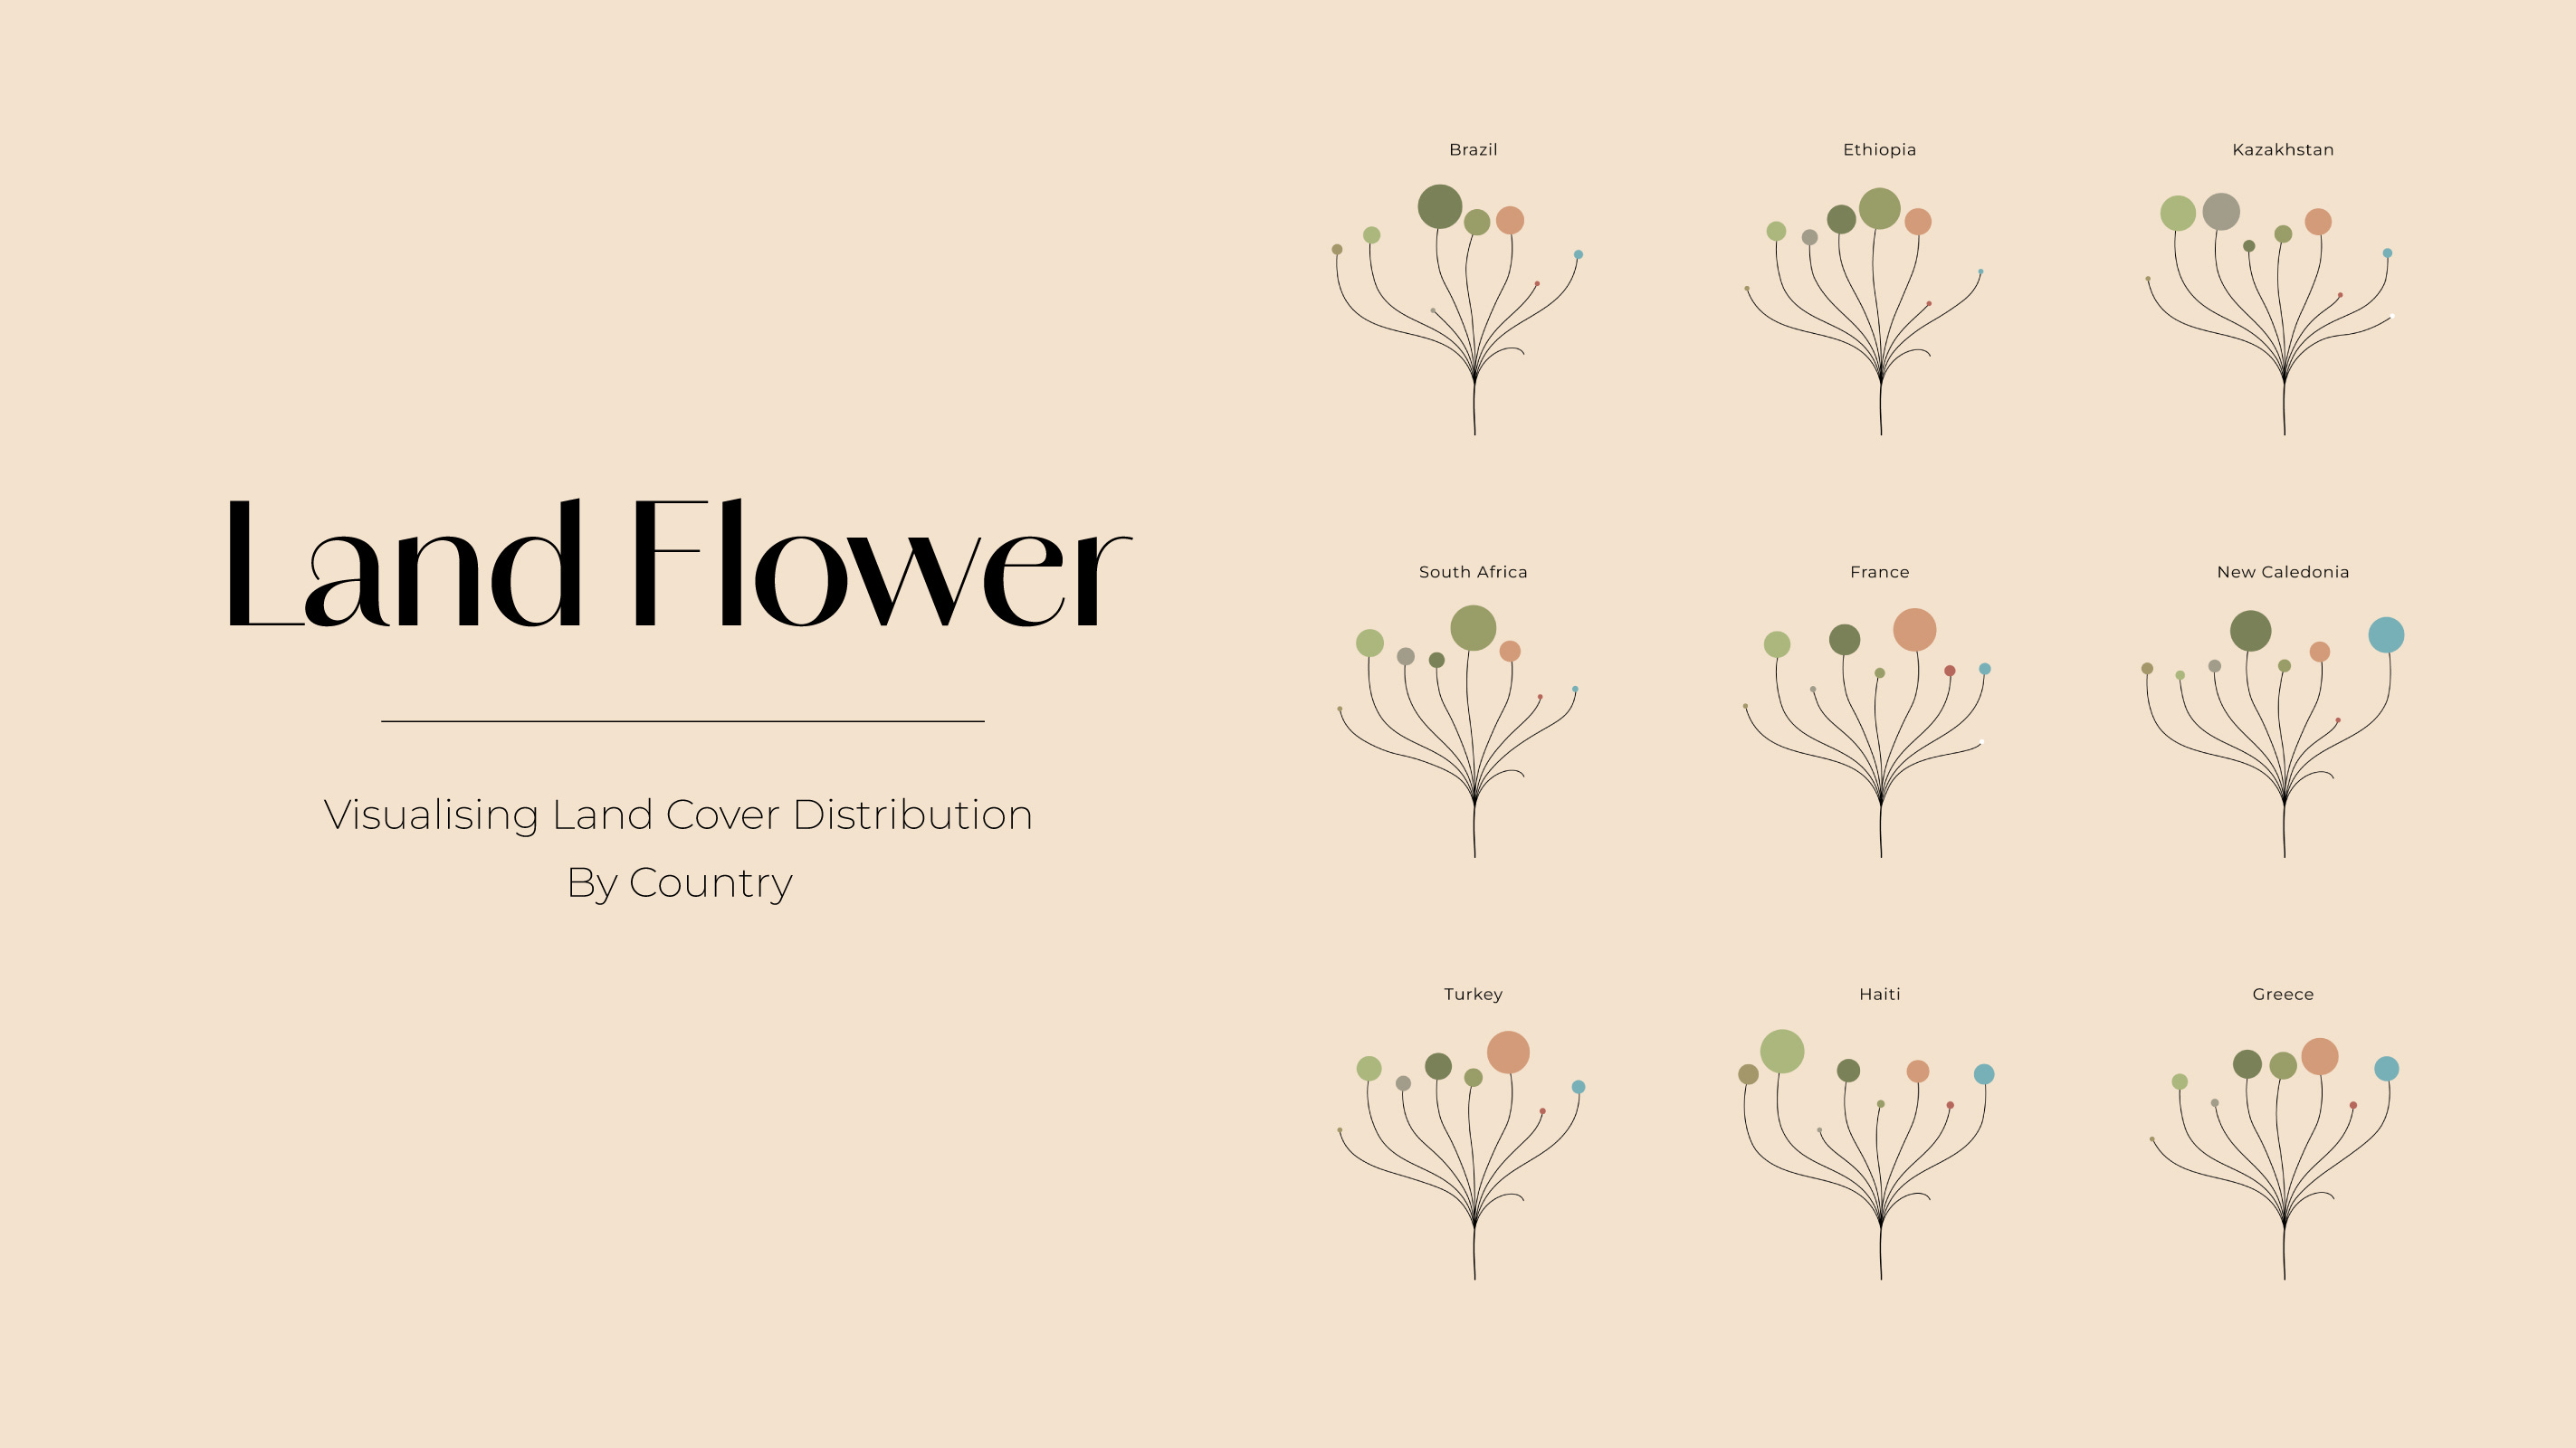
6. A Non-Mappy Visualisation of Land Cover Distribution
Ever since I got into EO, I have thought quite a bit about different ways to visualise geospatial data. More often than not, the visuals derived from EO are maps, maps or maps (and sometimes graphs). So, I found this idea from Noomia1 to be very creative in visualising land cover distribution, on a country level.
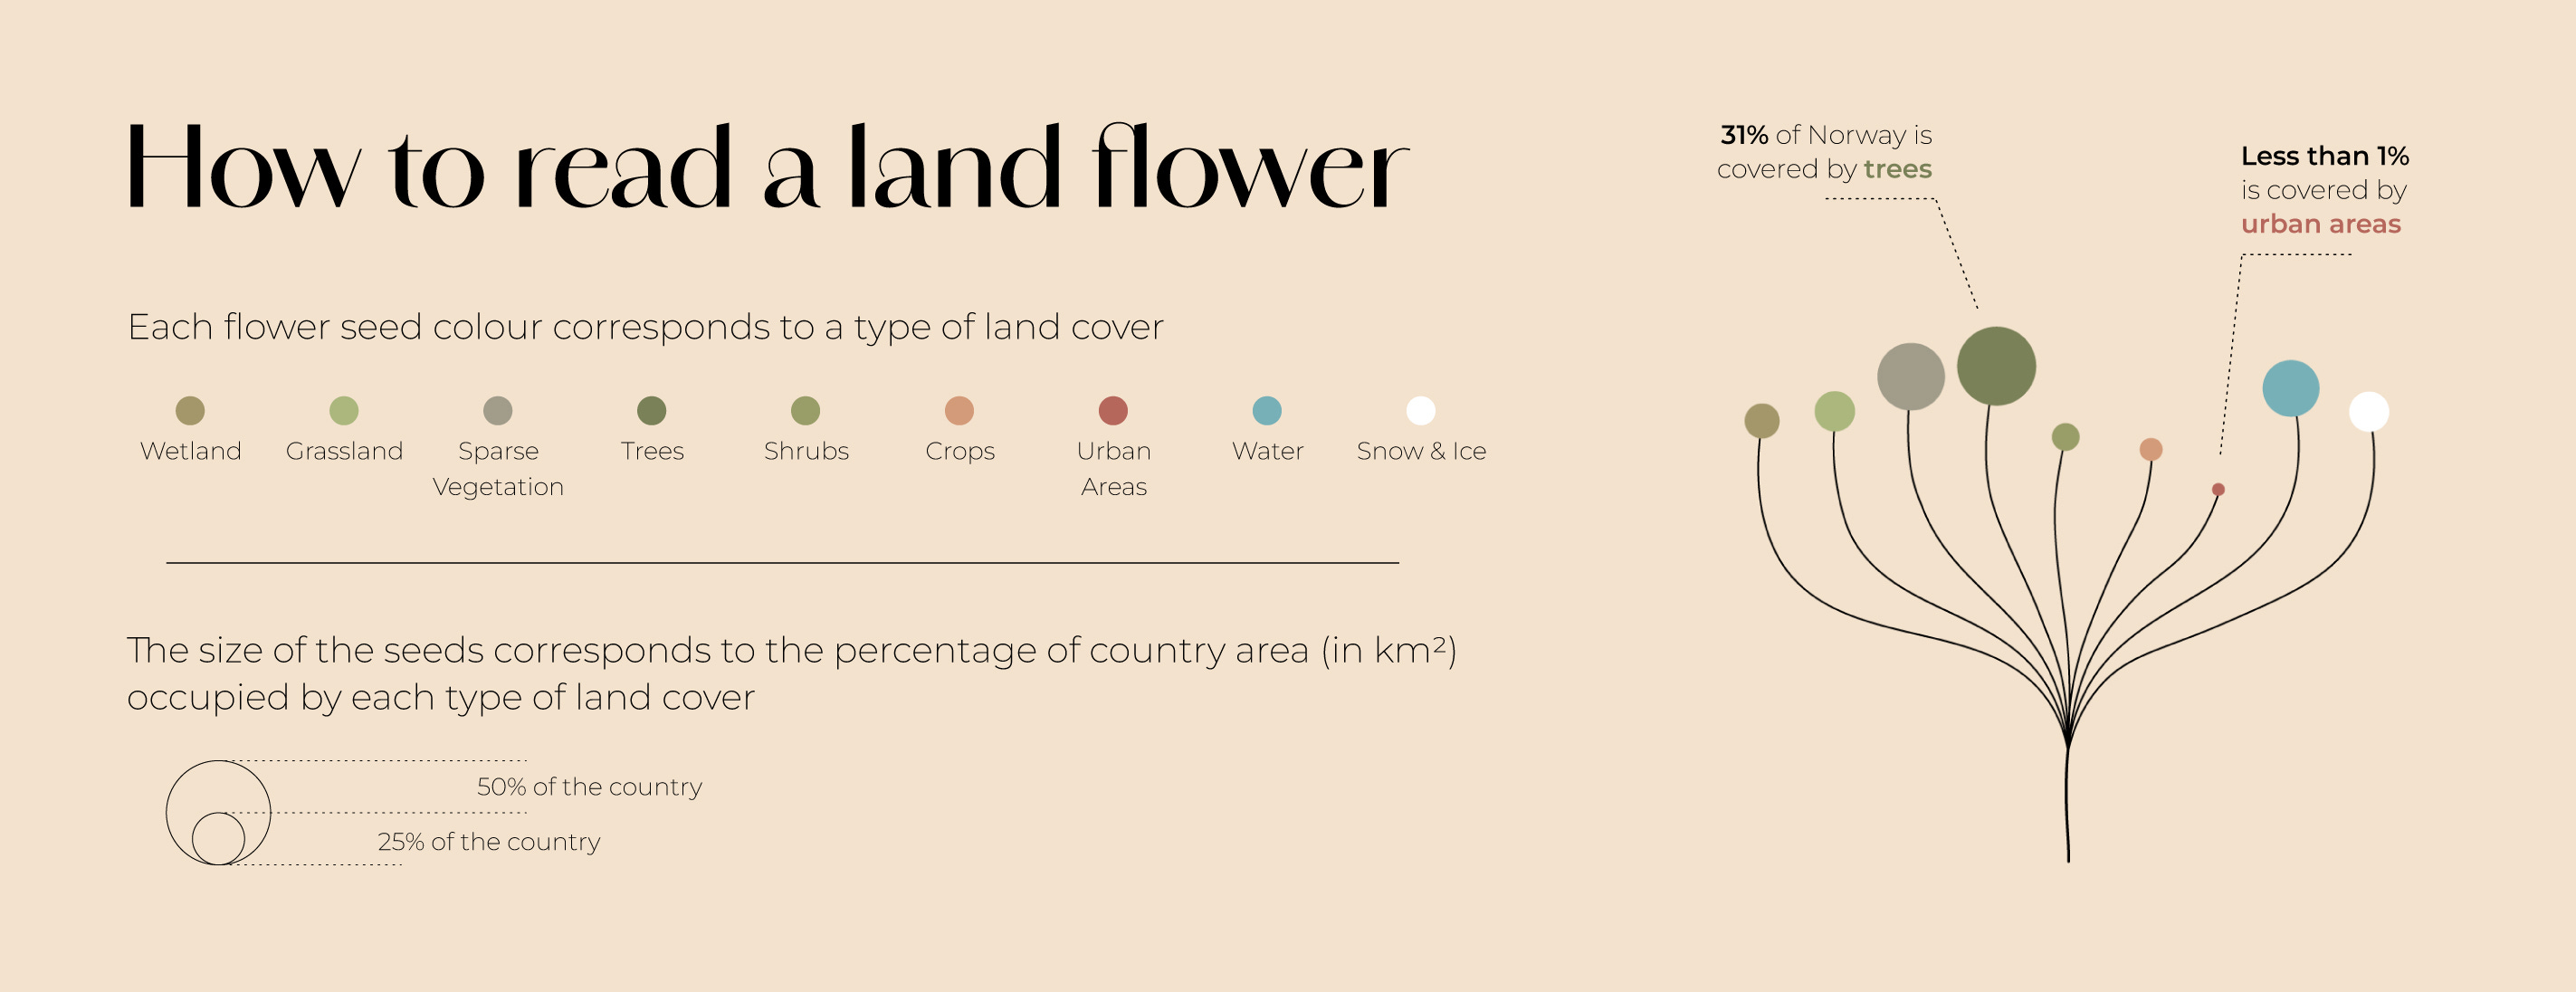
Land cover data details the physical land types on the planet (trees, grass, water etc.) and is usually represented using maps. In contrast with traditional mapping, the land flower is a visual awareness tool that provides a snapshot of land cover distribution in a given country or area and allows easy visual comparison over time and across countries.
The colour scheme, explained below, was created to make it easy to grasp land cover issues. Natural areas are presented in shades of green while artificial areas, such as croplands and urban areas, are coloured in shades of red. With just a quick look at a land flower, anyone can perceive balance -or lack thereof- between natural and artificial areas, receding water bodies and snow linked to climate change or even issues with expansive croplands and deforestation, especially when visualised over time. Thoughts?
Until next time,
Aravind.
Noomia Design Studio is the official creative and design partner of TerraWatch. ↩


